我在R中有一个facet grid ggplot2图,我想为每个facet叠加一条水平线和一个ribbon。我已经分别为水平线和ribbon值制作了单独的数据框。然而,当添加ribbon时,我遇到了'object not found error'的问题。
下面是一些可重复的代码。
# create DF
df1 = data.frame( x = rep(letters[1:4], 4),
y = rnorm(16, 0 , 1),
group = rep(1:4, each=4))
# horizonal line DF
hLines = data.frame(group = unique(df1$group) ,
y = aggregate(y ~ group, data=df1 , FUN=mean)[2] )
# CIs DF
hCIs = data.frame(group = unique(df1$group),
low = hLines$y - (2 * aggregate(y ~ group, data=df1 , FUN=sd)[2] ),
high = hLines$y + (2 * aggregate(y ~ group, data=df1 , FUN=sd)[2] ) )
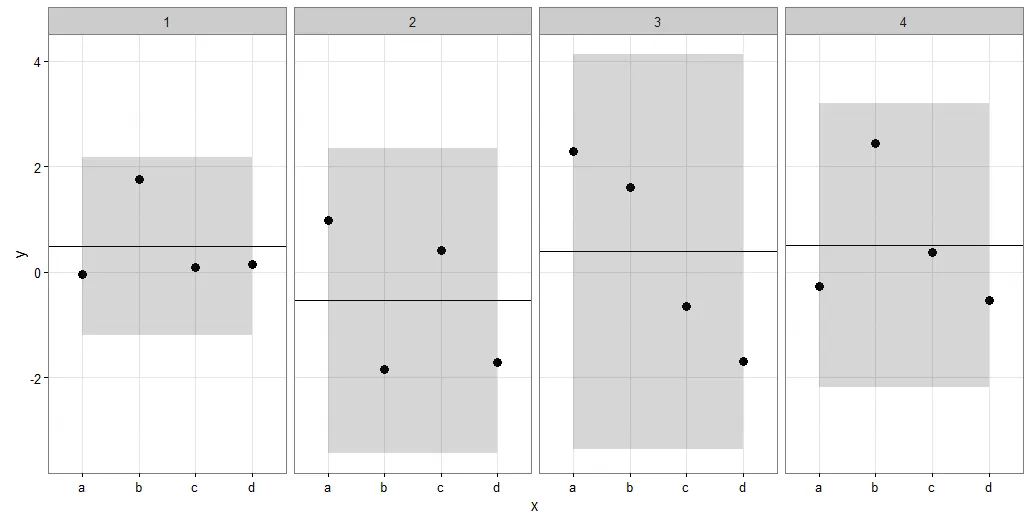
ggplot(df1 , aes(x = x , y = y)) +
facet_grid(~group) +
geom_point(size=3) +
geom_hline(data=hLines, aes(yintercept = y))+
geom_ribbon(data=hCIs, aes(x=x, ymin=low, ymax=high))+
theme_bw()
当没有包含geom_ribbon命令时,它可以工作。但是当我尝试添加ribbon时,会出现以下错误:
Error in eval(expr, envir, enclos) : object 'low' not found
非常感谢你的帮助。
编辑: 我在hCIs列名中犯了一个错误。然而,当指定以下内容时:
colnames(hCIs) = c("group", "low", "high")
我仍然收到一个错误:
错误:美学必须是长度为1或与数据相同(4):x,ymin,ymax,y
hCIs,没有叫做 low 的列。 - ercgeom_ribbon中保留x=x,则会出现以下错误:Error in eval(expr, envir, enclos) : object 'x' not found但如果我使用:geom_ribbon(data=hCIs, aes(group = 1, x = low,ymin=low, ymax=high), inherit.aes=FALSE),则不会出现任何错误,图表将显示。 - Miha