我希望使用ggplot2绘制分位数-分位数图。
我有以下数据:
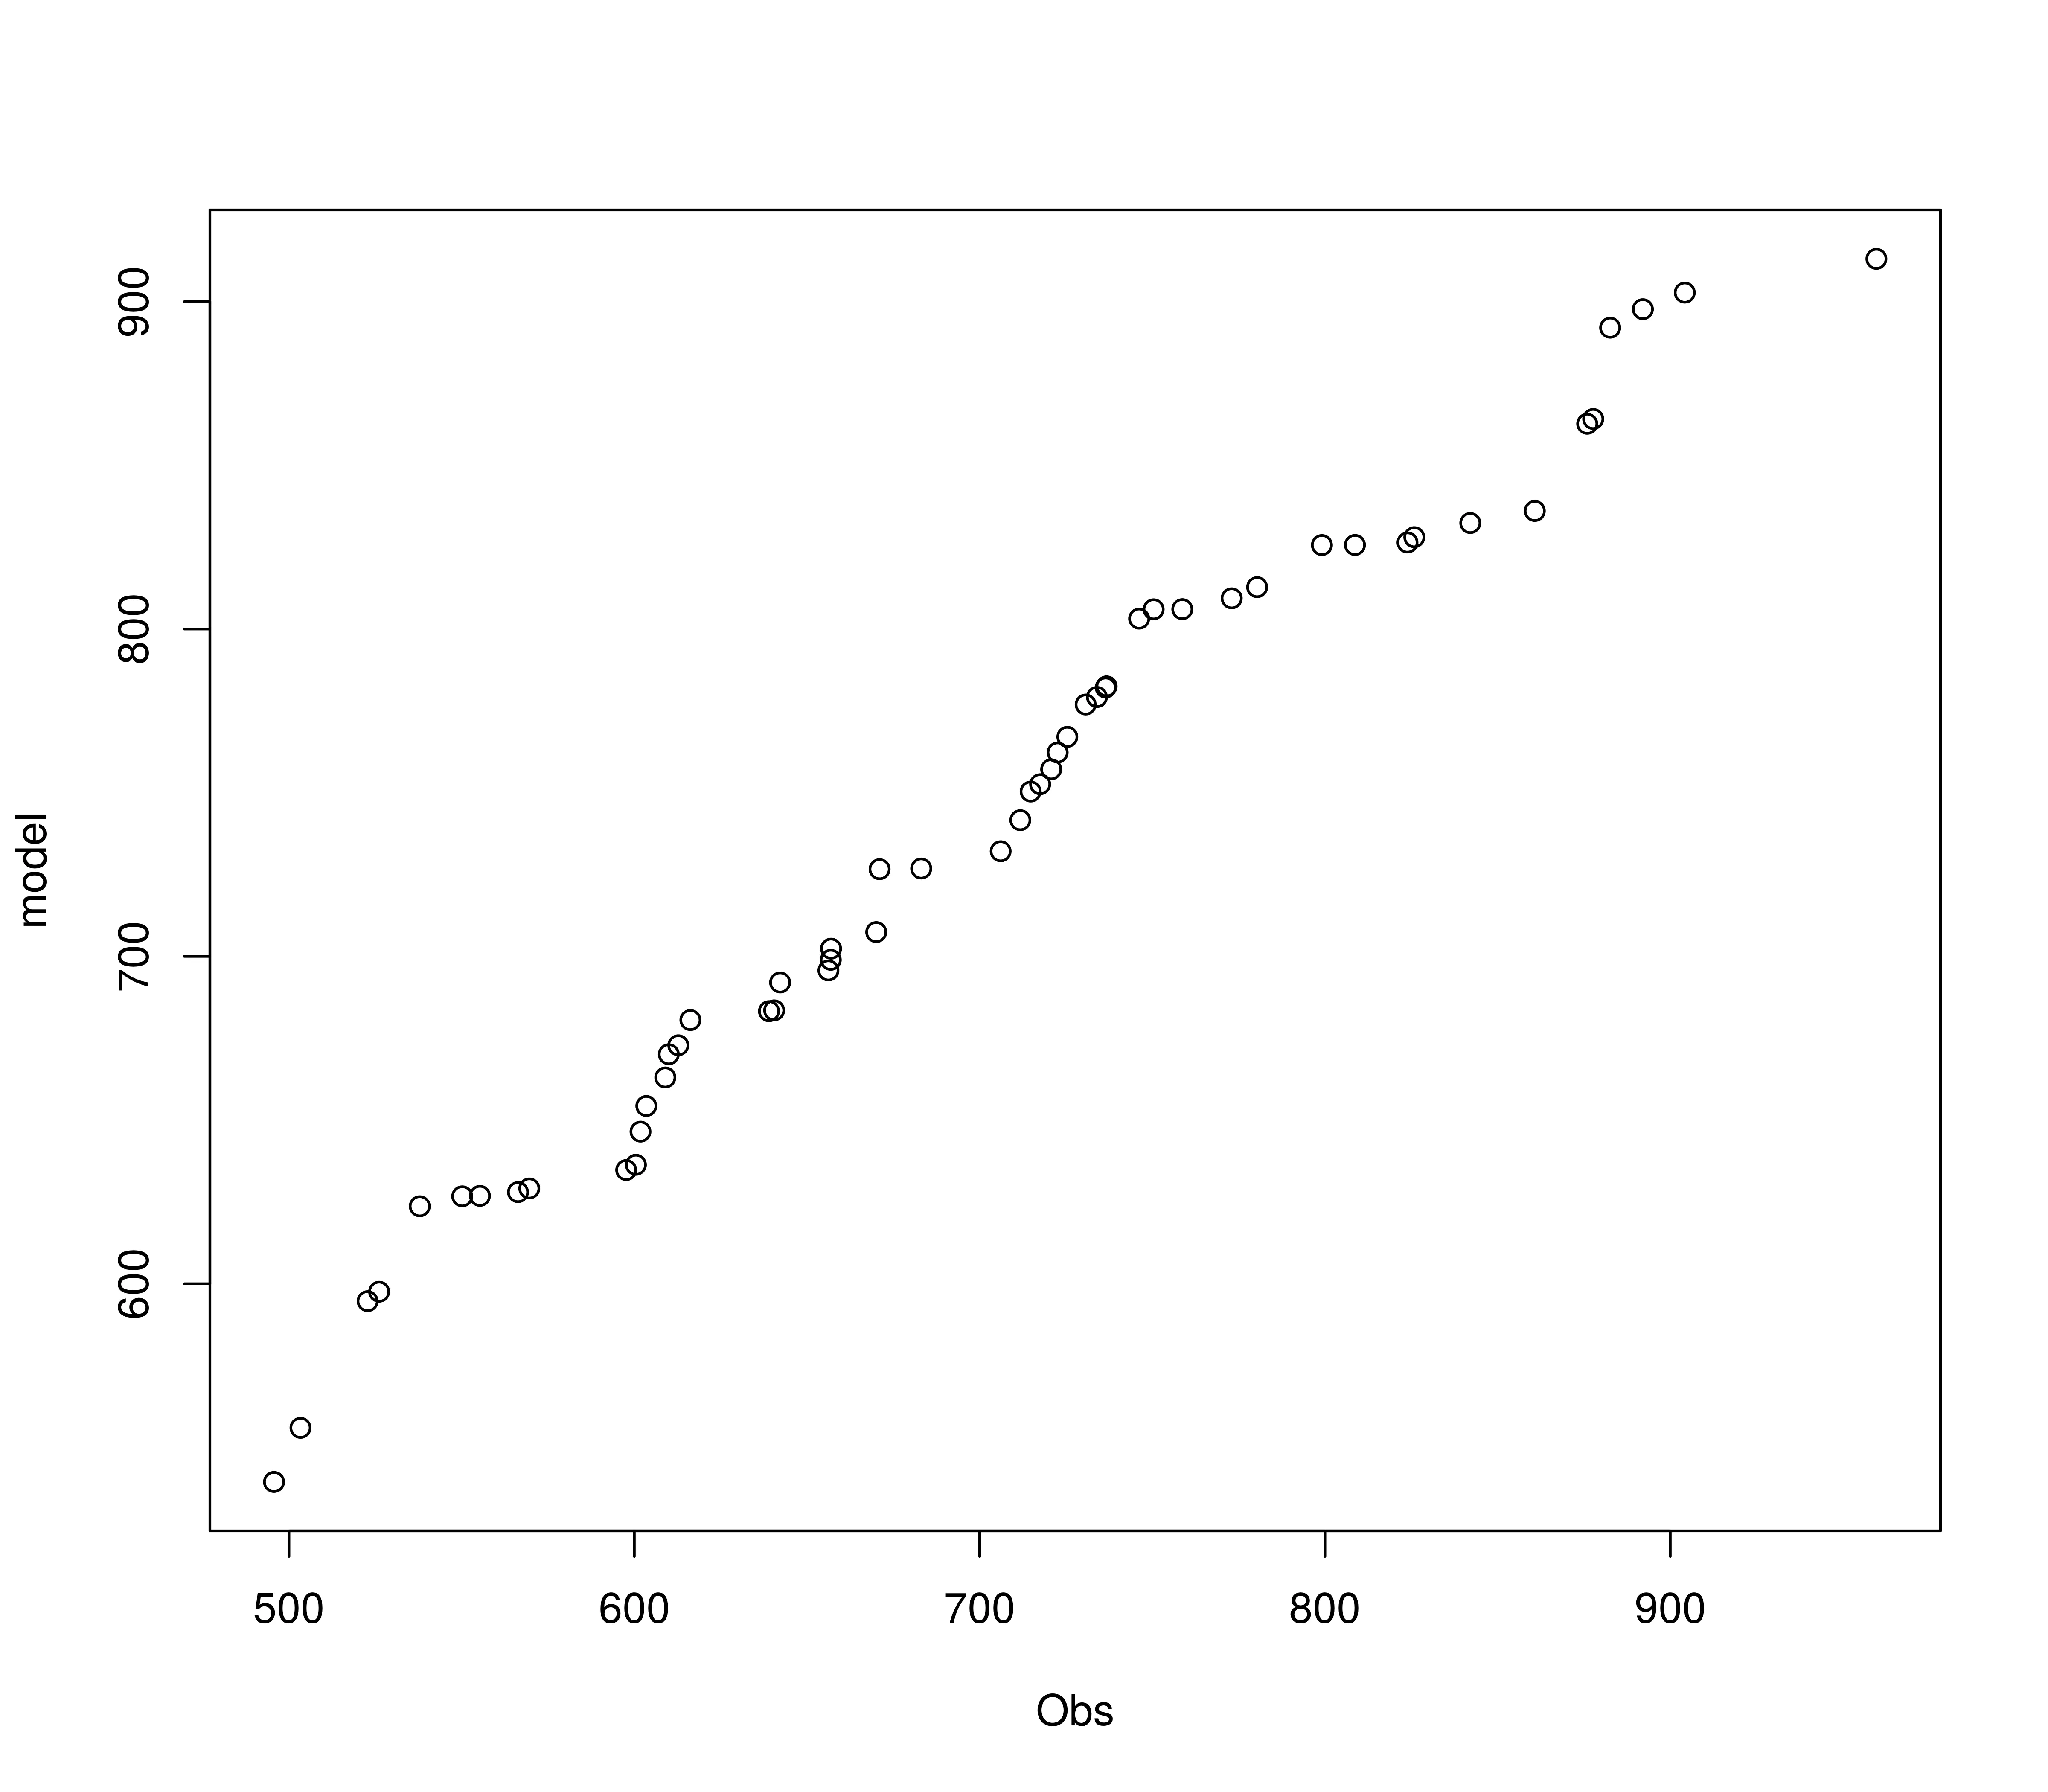
model <- c(539.4573, 555.9882, 594.6838, 597.5712, 623.6659, 626.7169, 626.8539, 627.9992, 629.1139, 634.7405, 636.3438, 646.4692, 654.3024, 663.0181, 670.0985, 672.8391, 680.5557, 683.2600, 683.5159, 692.0328, 695.7185, 698.9505, 702.3676, 707.4271, 726.6507, 726.8524, 732.1197, 741.6183, 750.3617, 752.5978, 757.1609, 762.2874, 767.0678, 776.9476, 779.2352, 782.1193, 782.5098, 803.1828, 806.0310,806.0684, 809.3937, 812.8044, 825.6459, 825.6808, 826.4363, 828.0537, 832.3820, 836.0761, 862.7044, 864.1710, 892.0614, 897.7099, 902.7762, 913.0856)

Obs <- c(736.7720, 616.2387, 495.6597, 603.4706, 522.7708, 503.3286, 597.6499, 566.3173, 569.5813, 550.1589, 730.7077, 526.1033, 642.2166, 720.7170, 537.8696, 656.8828, 736.4988, 555.2904, 711.7803, 670.0493, 638.9948, 799.1116, 825.8668, 608.9737, 750.3825, 601.7922, 612.7352, 656.2068, 609.9878, 714.7711, 717.5175, 640.4917, 725.3937, 842.0838, 671.0265, 808.6822, 780.3558, 706.0857, 733.9746, 746.1896, 758.6903, 877.6814, 959.6846, 656.9653, 882.5842, 860.7533, 683.0813, 722.5920, 600.4500, 823.8956, 772.9894, 904.1999, 875.9391, 892.0576)
我可以使用qqplot绘制我的分位数-分位数图:
qqplot(x=model, y=Obs)
问题在于我有一个包含多个组的数据框中的这些数据(在示例中我使用相同的模型,但实际上我有三种不同的模型):
df <- rbind(data.frame(Model=model, Obs=Obs, type="a"), data.frame(Model=model, Obs=Obs, type="b"), data.frame(Model=model, Obs=Obs, type="c"))
我想为每种类型绘制一个qq图:
p <- ggplot(df)
p <- (p + stat_qq(aes(sample=Model, colour=type)))
print(p)
这个方法可以运行,但是它将每个模型的分位数绘制在正态分布上。我希望将它们绘制在观察到的分位数上。在“stat_qq”的帮助文档中提到了一个参数“Distribution function to use, if x not specified”,所以我猜测可以使用参数x来替换正态分布:
p <- ggplot(df)
p <- (p + stat_qq(aes(sample=Model, x=Obs, colour=type)))
print(p)
但是我遇到了以下错误:
Error : geom_point requires the following missing aesthetics: x
有人能帮我吗?