很抱歉可能会问一些简单的问题。我是一名程序员,虽然我很少处理图形,但在为这个问题苦恼了数小时后,现在是时候寻求一些帮助了。我正在使用ggplot在R中创建一个多面板图,但是我无法找到一种方法来显示图标题,除了使用ggplot之外。
以下是我想让我的代码实现的内容:
par(mfrow = c(1, 2), pty = "s", las = 1, mgp = c(2, 0.4, 0), tcl = -0.3)
qqnorm(rnorm(100), main = "")
mtext("a", side = 3, line = 1, adj = 0, cex = 1.1)
qqnorm(rnorm(100), main = "")
mtext("b", side = 3, line = 1, adj = 0, cex = 1.1)
如何将上述代码生成的图中的"a"和"b"标签,放到以下代码相应的位置?
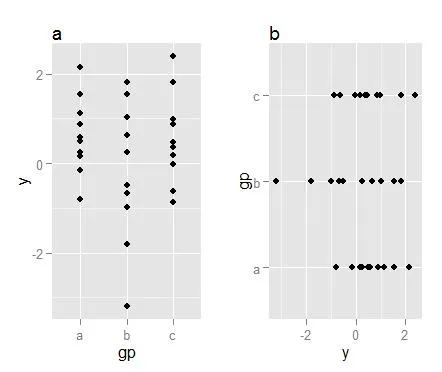
df = data.frame(gp = factor(rep(letters[1:3], each = 10)), y = rnorm(30))
p = ggplot(df) + geom_point(aes(x = gp, y = y))
p2 = ggplot(df) + geom_point(aes(x = y, y = gp))
grid.arrange(p, p2, ncol = 2)
提前感谢您的帮助!