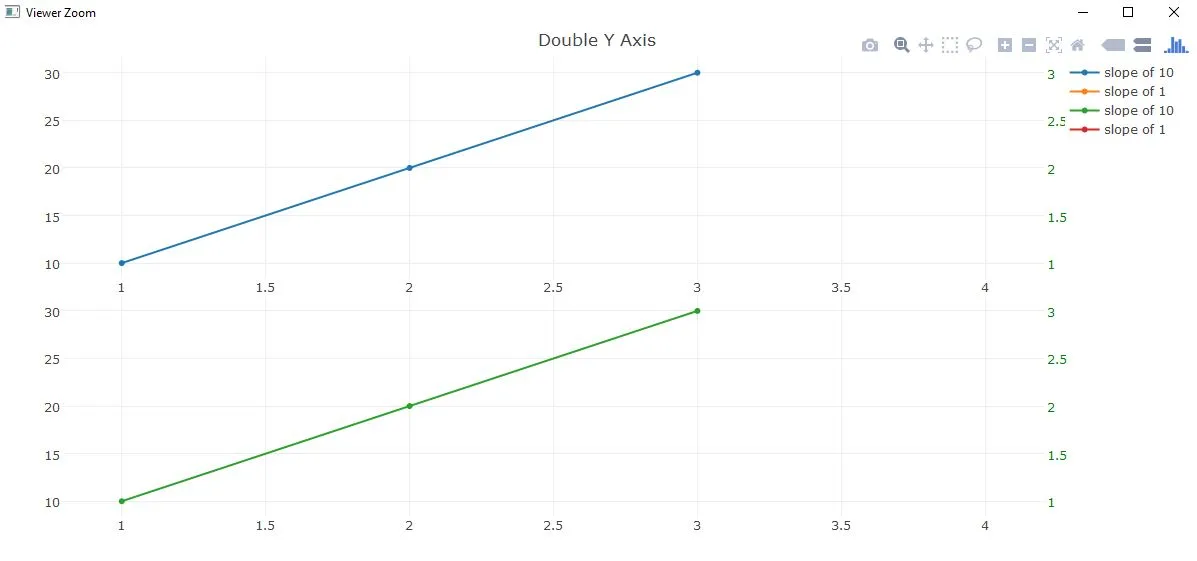
我想要做出每个图表有两个坐标轴的多图展示,就像这样:
library(plotly)
ay <- list(
  tickfont = list(color = "green"),
  overlaying = "y",
  side = "right", title = "y2 axis title"
)


par(mfrow=c(2,1))
ax <-list(title = "x axis title")
ay1 <-list(title = "y1 axds title")
plot_ly(x = 1:3, y = 10*(1:3), name = "slope of 10") %>%
  add_trace(x = 2:4, y = 1:3, name = "slope of 1", yaxis = "y2") %>%
  layout(title = "Double Y Axis", yaxis2 = ay, xaxis = ax, yaxis = ay1)


 ax <-list(title = "x axis title")
 ay1 <-list(title = "y1 axds title")
 plot_ly(x = 1:3, y = 10*(1:3), name = "slope of 10") %>%
   add_trace(x = 2:4, y = 1:3, name = "slope of 1", yaxis = "y2") %>%
   layout(title = "Double Y Axis", yaxis2 = ay, xaxis = ax, yaxis = ay1)
但是当你运行这段代码时,你仍然只能看到一个图。 plotly可以做多个图吗?它可以在两个轴上进行细分吗?