在ggplot R中对geom_point进行标记

3

我正在尝试重新绘制一张图表,其中有几条线在图例中,但是除此之外,图表还有一些点。如何在这个图表上标记这些点。请注意,这些点不在数据框中。我的代码现在看起来像这样:

ggplot(df, aes(x=tau_3)) + 
  geom_line(aes(y= a1, color = "blue")) + 
  geom_line(aes(y= a2, color = "green"))+ 
  xlim(0,0.6) + 
  ylim(0,0.4) +  
  geom_point(aes(0,0), size =5 , shape = "square")  + 
  geom_point(aes(0,1/6), size =5 , shape = "circle") +   
  geom_point(aes(0,0.1226), size =5 , shape = "triangle")  +  
  scale_color_discrete(name = "Legend", labels = c("GLO", "GEV"))

你有一些数据可以处理吗? - Liman
2个回答

2
为标记点,您可以通过添加带有坐标和标签的geom_text图层来实现。
mtcars数据集为例,尝试以下代码:
library(ggplot2)

ggplot() +
  geom_point(data = mtcars, aes(hp, mpg, color = factor(cyl))) +
  geom_point(aes(200, 25), color = "black") +
  geom_point(aes(100, 12), color = "purple") +
  geom_text(aes(200, 25), label = "I'm a black point", color = "black", nudge_y = .5) +
  geom_text(aes(100, 12), label = "I'm a purple point", color = "purple", nudge_y = -.5)


谢谢,这个很好用!我有一个问题,如何改变标签的大小? - Elliot
嗨@Elliot。欢迎您。您可以使用“size”参数调整字体大小。请注意,大小以“mm”为单位测量。有关样式和位置调整的更多信息,请参见https://ggplot2.tidyverse.org/articles/ggplot2-specs.html#text-1。 - stefan
我需要将geom_text()函数中的size参数放在aes()函数内吗?因为我没有看到任何区别。 - Elliot
抱歉,不行。将 size 放在 aes 外面。这就是我们所说的“使用 xxx 作为参数”。(; - stefan

0
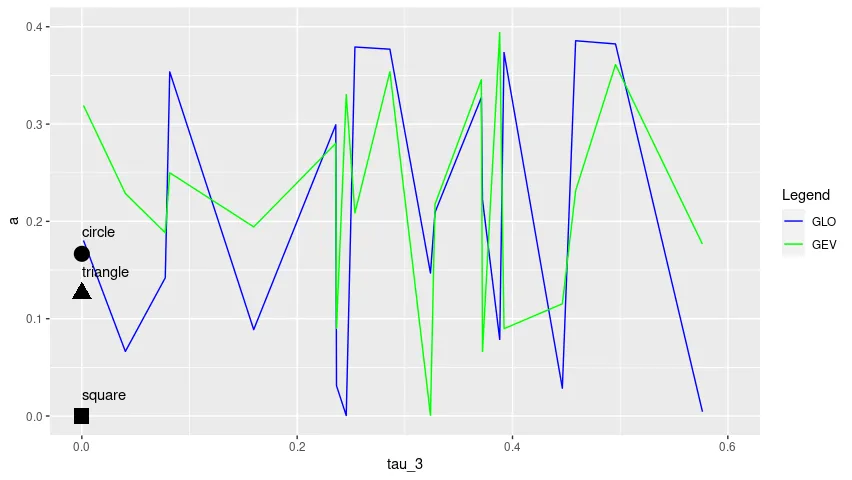
一种解决问题的方法是将点的坐标和形状放入一个辅助数据框 df_points 中,并在 geom_pointgeom_text 中使用它。
至于线条,将数据从宽格式 转换为长格式,然后调用一次 geom_line 即可。设置参数 inherit.aes = FALSE,对于 geom_point 还要设置show.legend = FALSE
library(ggplot2)
library(dplyr)
library(tidyr)

df_points <- data.frame(x = rep(0, 3), 
                        y = c(0, 1/6, 0.126),
                        shape = factor(c("square", "circle", "triangle"), 
                                       levels = c("square", "circle", "triangle")))

df %>%
  pivot_longer(
    cols = starts_with('a'),
    names_to = 'y',
    values_to = 'a'
  ) %>%
  ggplot(aes(tau_3, a, color = y)) +
  geom_line() +
  geom_point(data = df_points, 
             mapping = aes(x, y, shape = shape), 
             size = 5, 
             show.legend = FALSE,
             inherit.aes = FALSE) +
  geom_text(data = df_points, 
            mapping = aes(x, y, label = shape), 
            vjust = -1.5, hjust = 0,
            inherit.aes = FALSE) +
  xlim(0,0.6) + 
  ylim(0,0.4) +  
  scale_color_manual(name = "Legend", 
                     values = c("blue", "green"),
                     labels = c("GLO", "GEV")) +
  scale_shape_manual(values = c("square", "circle", "triangle"))

enter image description here

测试数据

set.seed(2020)
n <- 20
tau_3 <- runif(n, 0, 0.6)
a1 <- runif(n, 0, 0.4)
a2 <- runif(n, 0, 0.4)
df <- data.frame(tau_3, a1, a2)

网页内容由stack overflow 提供, 点击上面的
可以查看英文原文,
原文链接