有人熟悉networkx吗?
我想得到一个超图,其中我想将超边作为其他彩色节点(大小取决于它们的值)设置在列表之外。并且我想将来自另一个列表的节点设置出来。Networkx网站上的文档和示例真的很少,但我相信这是可能的。
我从这个例子开始,但这仅仅是不同边缘的一个例子。有人能告诉我如何在networkx中放置两组不同颜色/大小的节点吗?
有人熟悉networkx吗?
我想得到一个超图,其中我想将超边作为其他彩色节点(大小取决于它们的值)设置在列表之外。并且我想将来自另一个列表的节点设置出来。Networkx网站上的文档和示例真的很少,但我相信这是可能的。
我从这个例子开始,但这仅仅是不同边缘的一个例子。有人能告诉我如何在networkx中放置两组不同颜色/大小的节点吗?
nodelist参数,以此类似的方式使用nx.draw_networkx_nodes来实现此目的:# Author: Aric Hagberg (hagberg@lanl.gov)
import matplotlib.pyplot as plt
import networkx as nx
G = nx.Graph()
G.add_edge('a', 'b', weight=0.6)
G.add_edge('a', 'c', weight=0.2)
G.add_edge('c', 'd', weight=0.1)
G.add_edge('c', 'e', weight=0.7)
G.add_edge('c', 'f', weight=0.9)
G.add_edge('a', 'd', weight=0.3)
elarge = [(u, v) for (u, v, d) in G.edges(data=True) if d['weight'] > 0.5]
esmall = [(u, v) for (u, v, d) in G.edges(data=True) if d['weight'] <= 0.5]
pos = nx.spring_layout(G) # positions for all nodes
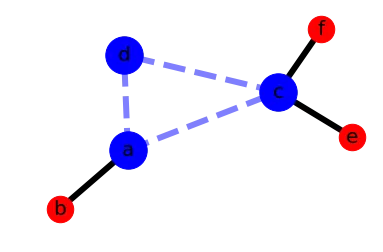
# nodes
nx.draw_networkx_nodes(G, pos, node_size=700, nodelist=['e','f','b'])
nx.draw_networkx_nodes(G, pos, node_size=1400, nodelist=['c','a','d'], node_color='blue')
# edges
nx.draw_networkx_edges(G, pos, edgelist=elarge,
width=6)
nx.draw_networkx_edges(G, pos, edgelist=esmall,
width=6, alpha=0.5, edge_color='b', style='dashed')
# labels
nx.draw_networkx_labels(G, pos, font_size=20, font_family='sans-serif')
plt.axis('off')
plt.show()
输出:
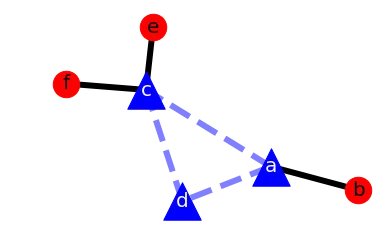
同时更改标签和形状:
# Author: Aric Hagberg (hagberg@lanl.gov)
import matplotlib.pyplot as plt
import networkx as nx

G = nx.Graph()

G.add_edge('a', 'b', weight=0.6)
G.add_edge('a', 'c', weight=0.2)
G.add_edge('c', 'd', weight=0.1)
G.add_edge('c', 'e', weight=0.7)
G.add_edge('c', 'f', weight=0.9)
G.add_edge('a', 'd', weight=0.3)

elarge = [(u, v) for (u, v, d) in G.edges(data=True) if d['weight'] > 0.5]
esmall = [(u, v) for (u, v, d) in G.edges(data=True) if d['weight'] <= 0.5]

pos = nx.spring_layout(G)  # positions for all nodes

# nodes
nx.draw_networkx_nodes(G, pos, node_size=700, nodelist=['e','f','b'])
nx.draw_networkx_nodes(G, pos, node_size=1400, nodelist=['c','a','d'],
                       node_color='blue', node_shape='^')

# edges
nx.draw_networkx_edges(G, pos, edgelist=elarge,
                       width=6)
nx.draw_networkx_edges(G, pos, edgelist=esmall,
                       width=6, alpha=0.5, edge_color='b', style='dashed')

# labels
nx.draw_networkx_labels(G, pos, font_size=20, font_family='sans-serif',
                        labels={'f':'f','e':'e','b':'b'})
nx.draw_networkx_labels(G, pos, font_size=20, font_family='sans-serif', font_color='white',
                        labels={'d':'d','a':'a','c':'c'})

plt.axis('off')
plt.show()
Output:
https://docs.discopy.org/en/main/_modules/discopy/hypergraph.html