Networkx - 从社区创建图形

4
使用以下可工作的代码:
import netowkx as nx
import networkx.algorithms.community as nx_comm

G = nx.karate_club_graph()

# Find the communities
communities = sorted(nx_comm.greedy_modularity_communities(G), key=len, reverse=True)
# Count the communities
print(f"The club has {len(communities)} communities.")

'''Add community to node attributes'''
for c, v_c in enumerate(communities):
    for v in v_c:
        # Add 1 to save 0 for external edges
        G.nodes[v]['community'] = c + 1
        

'''Find internal edges and add their community to their attributes'''
for v, w, in G.edges:
    if G.nodes[v]['community'] == G.nodes[w]['community']:
        # Internal edge, mark with community
        G.edges[v, w]['community'] = G.nodes[v]['community']
    else:
        # External edge, mark as 0
        G.edges[v, w]['community'] = 0

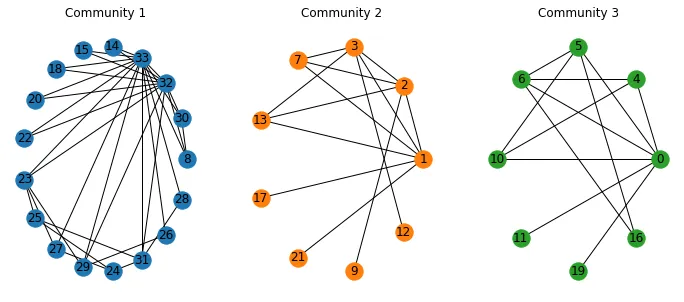
我该如何得到n个新的图形(或子图),每个社区都有一个对象(描述为“具有n个节点和w条边的图形”)?
1个回答

4
您可以采用与这个类似的方法。首先,您可以为每个社区创建一个图形。然后,您可以使用[(u,v,d) for u,v,d in G.edges(data=True) if d['community'] == i+1])来识别要添加到每个图形中的边缘。

以下是代码示例:

import networkx as nx
import networkx.algorithms.community as nx_comm
import matplotlib.pyplot as plt

G = nx.karate_club_graph()

# Find the communities
communities = sorted(nx_comm.greedy_modularity_communities(G), key=len, reverse=True)

# Count the communities
print(f"The club has {len(communities)} communities.")

'''Add community to node attributes'''
for c, v_c in enumerate(communities):
    for v in v_c:
        # Add 1 to save 0 for external edges
        G.nodes[v]['community'] = c + 1

'''Find internal edges and add their community to their attributes'''
for v, w, in G.edges:
    if G.nodes[v]['community'] == G.nodes[w]['community']:
        # Internal edge, mark with community
        G.edges[v, w]['community'] = G.nodes[v]['community']
    else:
        # External edge, mark as 0
        G.edges[v, w]['community'] = 0


N_coms=len(communities)
edges_coms=[]#edge list for each community
coms_G=[nx.Graph() for _ in range(N_coms)] #community graphs
colors=['tab:blue','tab:orange','tab:green']
fig=plt.figure(figsize=(12,5))

for i in range(N_coms):
  edges_coms.append([(u,v,d) for u,v,d in G.edges(data=True) if d['community'] == i+1])#identify edges of interest using the edge attribute
  coms_G[i].add_edges_from(edges_coms[i]) #add edges
  plt.subplot(1,3,i+1)#plot communities
  plt.title('Community '+str(i+1))
  pos = nx.circular_layout(coms_G[i])
  nx.draw(coms_G[i],pos=pos,with_labels=True,node_color=colors[i]) 

输出结果如下:

在此输入图片描述


网页内容由stack overflow 提供, 点击上面的
可以查看英文原文,
原文链接