Networkx:在图中为社区(节点)指定颜色

4
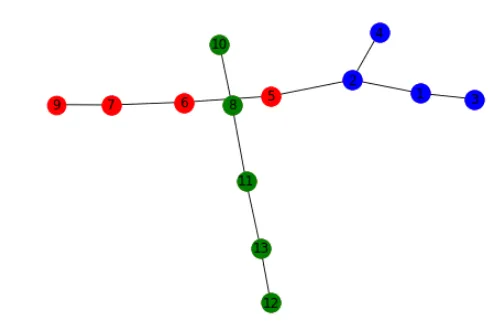
我希望为每个检测到的社区绘制一个有着不同颜色节点的网络图(我已经有了每个社区的节点列表)。
目前我拥有的是类似于这样的内容:
plot = nx.draw(G3, nodecolor='r', node_color= 'white', edge_color='k',
         with_labels=True, font_weight='light', node_size= 280, width= 0.9)
plt.savefig('graphe.png')
plt.show()

我该如何实现这样一个功能,使得每个社区都有特定的颜色呢?
1个回答

9
你离成功不远了。你只需要逐个绘制节点集合,一个社区接一个社区。同时,由于我们是逐步绘制的,因此必须固定节点的位置。为此,我们使用nx.spring_layout() 下面是一个带有虚拟数据的可行示例,以帮助你跟随翻译。
node_lists_community1 = [1,2,3, 4]
node_lists_community2 = [5, 6, 7]
node_lists_community3 = [8,10,11,12, 13]
all_nodes = node_lists_community1+ node_lists_community2+ node_lists_community3

#list of edges
elist = [(1,2), (1,3), (2,4), (2, 5), (5,6), (6,7),
        (7,9), (8,10), (8,11), (11,13), (12,13)]

#create the networkx Graph with node types and specifying edge distances
G3 = nx.Graph()
for n in all_nodes:
    G3.add_node(n)
for from_loc, to_loc in elist:
    G3.add_edge(from_loc, to_loc)   

pos = nx.spring_layout(G3) #calculate position for each node
# pos is needed because we are going to draw a few nodes at a time,
# pos fixes their positions.

# Notice that the pos dict is passed to each call to draw below

# Draw the graph, but don't color the nodes
nx.draw(G3, pos, edge_color='k',  with_labels=True,
         font_weight='light', node_size= 280, width= 0.9)

#For each community list, draw the nodes, giving it a specific color.
nx.draw_networkx_nodes(G3, pos, nodelist=node_lists_community1, node_color='b')
nx.draw_networkx_nodes(G3, pos, nodelist=node_lists_community2, node_color='r')
nx.draw_networkx_nodes(G3, pos, nodelist=node_lists_community3, node_color='g')

plt.savefig('graphe.png')
plt.show()

在此输入图片描述

如果有不清楚的地方,请询问。


1
尽管在这方面缺乏文档,但实际上您可以按节点传递“node_color”规范:g = nx.erdos_renyi_graph(100, 0.2); nx.draw_networkx(g, node_color=50*['b'] + 50*['g']) - Paul Brodersen
非常好的观点,@Paul。等我有一些时间,我会更新解决方案,也包括这个。 - Ram Narasimhan

网页内容由stack overflow 提供, 点击上面的
可以查看英文原文,
原文链接