我创建了图表,目前一切看起来都很好,但是我想在创建后更新节点的颜色。
我的目标是可视化深度优先搜索,我将首先显示初始图形,然后随着 DFS 解决问题,逐步着色节点。
如果有人感兴趣,示例代码可在 Github 上找到。
你只需要指定一个颜色映射,将每个节点映射到一个颜色并将其发送给nx.draw函数。为了澄清,对于20个节点,我想将前10个着色为蓝色,其余的着色为绿色。代码如下:
G = nx.erdos_renyi_graph(20, 0.1)
color_map = []
for node in G:
    if node < 10:
        color_map.append('blue')
    else:
        color_map.append('green')
nx.draw(G, node_color=color_map, with_labels=True)
plt.show()
你可以在附加的图片中找到这个图表: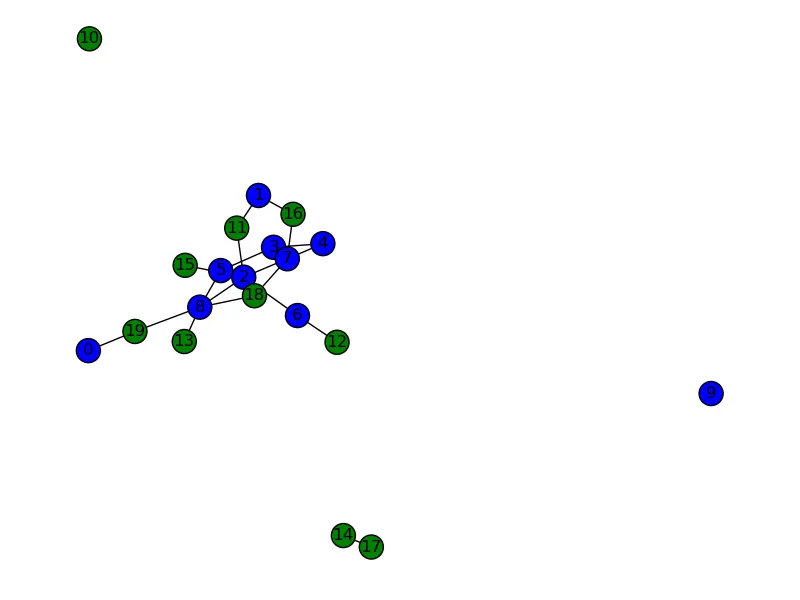 。
。
参考node_color参数:
nx.draw_networkx_nodes(G, pos, node_size=200, node_color='#00b4d9')
这个问题之前已经有了答案,但您也可以这样做:
# define color map. user_node = red, book_nodes = green
color_map = ['red' if node == user_id else 'green' for node in G]
graph = nx.draw_networkx(G,pos, node_color=color_map) # node lables
from sklearn.model_selection import train_test_split)。我想改变每个组的颜色(默认颜色非常糟糕!)。花了一些时间才找到如何更改它,但是Tensor基于Numpy,而Matplotlib是networkx库的核心。因此...test=data.y
test=test.numpy()
test=test.astype(np.str_)
test[test == '0'] = '#C6442A'
test[test == '1'] = '#9E2AC6'
nx.draw(G, with_labels=True, node_color=test, node_size=400, font_color='whitesmoke')
简而言之:将Tensor转换为字符串类型的numpy数组,查找最佳的HTML十六进制颜色代码(https://htmlcolorcodes.com/),然后你就可以开始了!
data.y是什么? - undefined