你只需要获取垂直线与水平线的交点,而不是平行线的交点。此外,由于存在垂直线,计算斜率可能会导致无穷大或溢出的斜率,因此不应使用 y = mx+b 方程。您需要完成两个步骤:
- 根据它们的角度将线段分为两类。
- 计算一个类中每条线与其他类中的线的交点。
使用 HoughLines 方法后,您已经得到了结果 rho,theta,因此您可以使用 theta 将其轻松地分成两个角度类别。您可以使用例如 cv2.kmeans(),以 theta 作为要拆分的数据。
然后,要计算交点,您可以使用 给定每条线两个点的公式。您已经在每条线中计算了两个点:(x1,y1),(x2,y2),因此您可以简单地存储这些值并使用它们。编辑:实际上,如下所示的代码中,有一个公式可用于计算具有 HoughLines 给出的 rho,theta 形式的线的交点。
我之前回答过一个类似的问题,并提供了一些 Python 代码供您参考;请注意,当时使用的是仅提供线段的 HoughLinesP。
代码示例
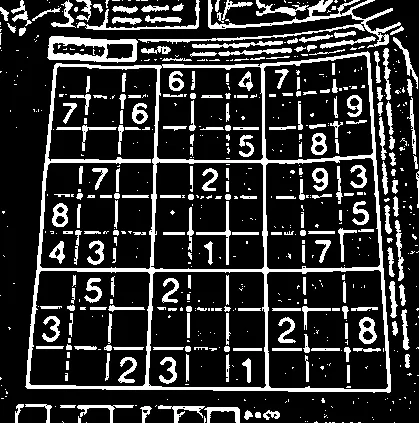
由于您没有提供原始图像,因此我不能使用它。取而代之的是,我将使用OpenCV在其Hough变换和二值化教程中使用的标准数独图像:

首先,我们只需读取此图像并使用自适应阈值二值化,就像在这个OpenCV教程中使用的那样:
import cv2
import numpy as np

img = cv2.imread('sudoku.jpg')
gray = cv2.cvtColor(img, cv2.COLOR_BGR2GRAY)
blur = cv2.medianBlur(gray, 5)
adapt_type = cv2.ADAPTIVE_THRESH_GAUSSIAN_C
thresh_type = cv2.THRESH_BINARY_INV
bin_img = cv2.adaptiveThreshold(blur, 255, adapt_type, thresh_type, 11, 2)
接下来,我们将使用cv2.HoughLines()函数查找霍夫线:
rho, theta, thresh = 2, np.pi/180, 400
lines = cv2.HoughLines(bin_img, rho, theta, thresh)

如果我们想要找出交汇点,实际上我们仅需要寻找垂直线的交汇点。我们不需要大部分平行线的交汇点。因此,我们需要对线进行分割。在这个特定的例子中,您可以根据一个简单的测试轻松地检查线是否为水平或垂直线;垂直线的 theta 大约为 0 或大约为 180;水平线的 theta 大约为 90。但是,如果您想要基于任意数量的角度进行自动分割,而无需定义这些角度,我认为最好的办法是使用 cv2.kmeans()。
有一件棘手的事情需要正确处理。HoughLines 返回以 rho, theta 形式(Hesse normal form)的线,返回的 theta 在 0 到 180 度之间,并且大约在 180 和 0 度之间的线是相似的(它们都接近水平线),因此我们需要一些方法在 kmeans 中获得这种周期性。
如果我们在单位圆上绘制角度,但将角度乘以 2,则最初大约在 180 度左右的角度将变得接近 360 度,因此它们将在单位圆上具有靠近 0 度的 x, y 值。因此,我们可以通过在单位圆上用坐标绘制 2*angle 来获得一些良好的“接近度”。然后,我们可以在这些点上运行 cv2.kmeans(),并使用任意数量的分割片段进行自动分割。
因此,让我们建立一个函数来进行分割:
from collections import defaultdict
def segment_by_angle_kmeans(lines, k=2, **kwargs):
"""Groups lines based on angle with k-means.
Uses k-means on the coordinates of the angle on the unit circle
to segment `k` angles inside `lines`.
"""
default_criteria_type = cv2.TERM_CRITERIA_EPS + cv2.TERM_CRITERIA_MAX_ITER
criteria = kwargs.get('criteria', (default_criteria_type, 10, 1.0))
flags = kwargs.get('flags', cv2.KMEANS_RANDOM_CENTERS)
attempts = kwargs.get('attempts', 10)
angles = np.array([line[0][1] for line in lines])
pts = np.array([[np.cos(2*angle), np.sin(2*angle)]
for angle in angles], dtype=np.float32)
labels, centers = cv2.kmeans(pts, k, None, criteria, attempts, flags)[1:]
labels = labels.reshape(-1)
segmented = defaultdict(list)
for i, line in enumerate(lines):
segmented[labels[i]].append(line)
segmented = list(segmented.values())
return segmented
现在我们可以简单调用它来使用:
segmented = segment_by_angle_kmeans(lines)
这里好的一点是我们可以通过指定可选参数k来指定任意数量的组(默认情况下,k = 2,所以我没有在这里指定它)。
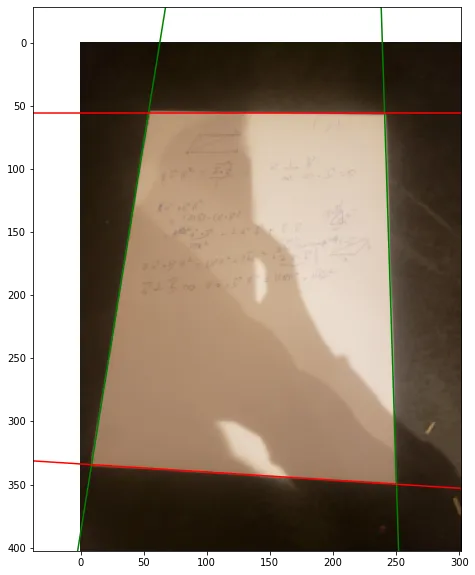
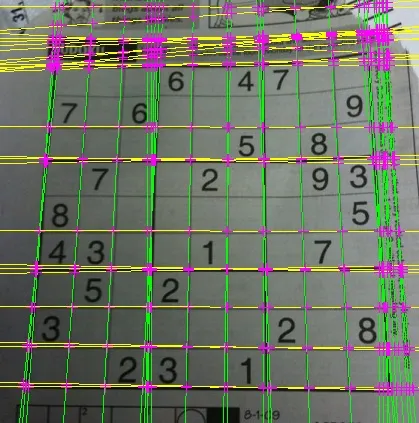
如果我们用不同的颜色绘制每个组的线:

现在要做的就是找到第一组中每条线与第二组中每条线相交的位置。由于这些线处于Hesse标准形式中,有一个很好的线性代数公式可以用于计算从这种形式定义的线的交点。请参见这里。让我们在这里创建两个函数; 一个仅查找两条线的交点,另一个函数循环遍历组中的所有线,并为两条线使用该简化函数:
def intersection(line1, line2):
    """Finds the intersection of two lines given in Hesse normal form.

    Returns closest integer pixel locations.
    See https://dev59.com/IHRC5IYBdhLWcg3wMd9S#383527
    """
    rho1, theta1 = line1[0]
    rho2, theta2 = line2[0]
    A = np.array([
        [np.cos(theta1), np.sin(theta1)],
        [np.cos(theta2), np.sin(theta2)]
    ])
    b = np.array([[rho1], [rho2]])
    x0, y0 = np.linalg.solve(A, b)
    x0, y0 = int(np.round(x0)), int(np.round(y0))
    return [[x0, y0]]


def segmented_intersections(lines):
    """Finds the intersections between groups of lines."""

    intersections = []
    for i, group in enumerate(lines[:-1]):
        for next_group in lines[i+1:]:
            for line1 in group:
                for line2 in next_group:
                    intersections.append(intersection(line1, line2))

    return intersections
然后使用它,只需要:
intersections = segmented_intersections(segmented)
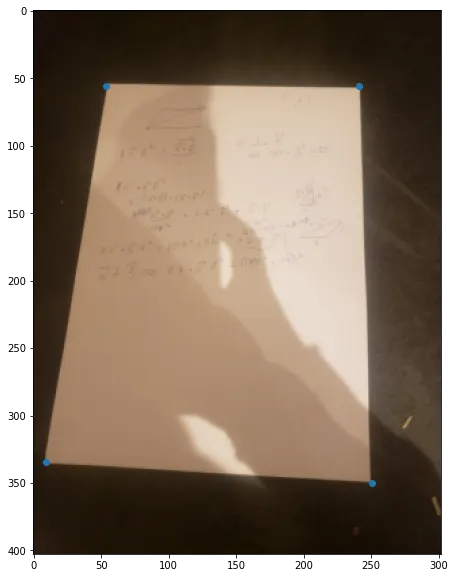
将所有交点绘制出来,我们可以得到:

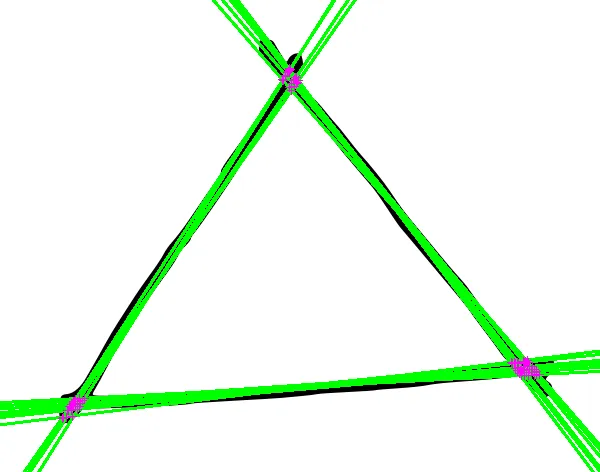
如上所述,这段代码还可以将线段分成多于两组的角度。这里展示了对一个手绘的三角形进行检测,并计算检测到的线段与k=3时的交点:

