如何在pandas图表中为每条线绘制水平线?

3

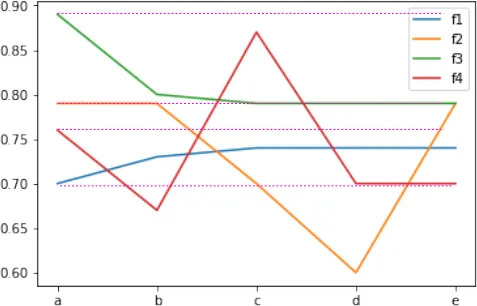
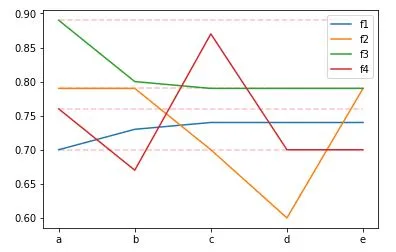
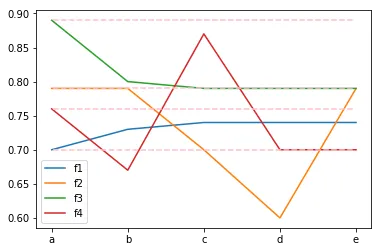
我需要从每条线下绘制的第一个点开始画出一条水平线。该线跨越从第一个x轴标记到最后一个x轴标记。要使用ax.hlines(),我需要知道xmaxxmin,但如果x值是分类的,我不知道它们是多少。如何画出这些水平线(用虚粉色线表示)?

mydf = DataFrame( [[0.70, 0.79, 0.89, 0.76],
               [0.73, 0.79, 0.80, 0.67],
               [0.74, 0.70, 0.79, 0.87],
               [0.74, 0.60, 0.79, 0.7],
               [0.74, 0.79, 0.79, 0.7]])
mydf.columns = ['f1', 'f2','f3','f4']
mydf.index = ['a','b','c','d','e']
ax = mydf.plot()
ax.set_xticks(range(len(mydf.index)))
ax.set_xticklabels([item for item in mydf.index.tolist()])

enter image description here

2个回答

4
你不需要循环列,只需添加以下行以绘制线条。
所有线条的 y 参数都将是起始点。mydf.iloc[0],xmin 将始终为 ax.get_lim()[0],xmax 将为 ax.get_lim()[1]。
有关更多信息,请参见docs
ax.hlines(mydf.iloc[0], ax.get_xticks().min(), ax.get_xticks().max(), linestyle='--', color='pink')

输出:

enter image description here


2

使用:

mydf = pd.DataFrame( [[0.70, 0.79, 0.89, 0.76],
               [0.73, 0.79, 0.80, 0.67],
               [0.74, 0.70, 0.79, 0.87],
               [0.74, 0.60, 0.79, 0.7],
               [0.74, 0.79, 0.79, 0.7]])

mydf.columns = ['f1', 'f2','f3','f4']
mydf.index = ['a','b','c','d','e']

ax = mydf.plot()
ax.set_xticks(range(len(mydf.index)))
ax.set_xticklabels([item for item in mydf.index.tolist()])

for i in range(len(mydf.columns)):
    ax.axhline(y=mydf.iloc[0,i], xmin=.05, xmax=.95, ls='--', color='pink')

关于 xminxmax

xmin:标量,可选,默认值为 0。应该在 0 和 1 之间,0 表示图的最左端,1 表示图的最右端。

xmax:标量,可选,默认值为 1。应该在 0 和 1 之间,0 表示图的最左端,1 表示图的最右端。

enter image description here


网页内容由stack overflow 提供, 点击上面的
可以查看英文原文,
原文链接