使用ggplot2绘制色彩编码的世界地图

5

我正在尝试生成一个世界地图的绘图,其中每个国家的颜色对应于数据框中存储的特定值。

> aggregated_country_data
   country num_responses                                     region
1       AL             1                                    Albania
2       AM             1                                    Armenia
3       AR            32                                  Argentina
...
75      ZW             3                                   Zimbabwe

这是我尝试过的内容。
library(rworldmap)
library(ggplot2)
map.world <- map_data(map="world")

gg <- ggplot()
gg <- gg + theme(legend.position="none")
gg <- gg + geom_map(data=map.world, map=map.world, aes(map_id=region, x=long, y=lat), fill="white", colour="black", size=0.25)
gg

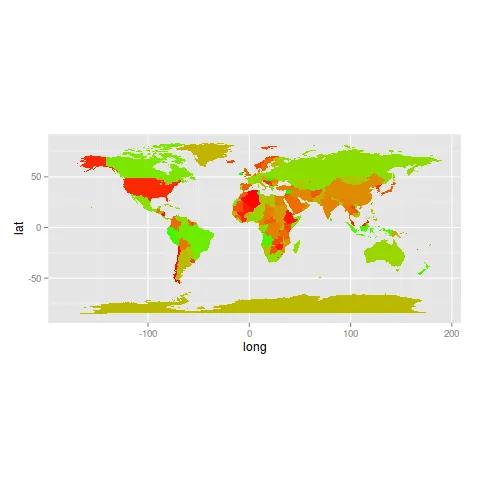
这段代码可以很好地绘制世界地图,接下来我想按照聚合的国家数据中“num_responses”的值比例为每个国家添加颜色。

gg <- gg + geom_map(data=aggregated_country_data, map=map.world, aes(map_id=region, fill=num_responses), color="white", size=0.25)
gg

现在它将每个颜色编码为对应于国家代码的颜色,而不是聚合国家数据中列num_responses中的值。

很明显我没有完全掌握ggplot2的使用方法,但我无法弄清楚问题所在。

如果您有任何建议,我将不胜感激, Brad


我找到了问题所在,与ggplot2或其他任何我正在做的事情无关。聚合国家数据数据框架中的'region'名称与map.world中不同。我的输入数据(aggregated_country_data)默认使用两个字母的国家代码,我使用countrycode R包将其转换为国家名称(在数据框中称为'region'),但它使用的名称约定与map.world中存在的名称约定不同。所以这是一个完全不同的问题。


1
你确定吗?在我的机器上看起来没问题。 - mucio
也许这篇文章可以有所帮助 [链接] (https://dev59.com/a2Ij5IYBdhLWcg3w4Y2S) - pacomet
@mucio它以彩色绘制地图,但是国家的颜色代码与“num_responses”列中的数字不匹配,它们似乎匹配于国家代码。但是我会再试一次。 - Brad Davis
也许可以使用 fill=factor(num_responses),否则颜色可能太相似了。 - mucio
我尝试过了,它根本没有显示与num_responses向量相关的颜色。我完全困惑了。 - Brad Davis
1个回答

9
library(rworldmap)
library(ggplot2)
map.world <- map_data(map="world")

#Add the data you want to map countries by to map.world
#In this example, I add lengths of country names plus some offset
map.world$name_len <- nchar(map.world$region) + sample(nrow(map.world))

gg <- ggplot()
gg <- gg + theme(legend.position="none")
gg <- gg + geom_map(data=map.world, map=map.world, aes(map_id=region, x=long, y=lat, fill=name_len))

gg <- gg + scale_fill_gradient(low = "green", high = "brown3", guide = "colourbar")
gg <- gg + coord_equal()
gg

enter image description here


也许可以移除南极洲,至少使用 coord_map() 函数? - hrbrmstr
@hrbrmstr 我最初的方法是在map_data()中使用projection="mercator",然后进行coord_map()。但是,在map_data()中将投影参数设置为"mercator"会出现错误:"Error in names[df$group, 1] : subscript out of bounds"。你有什么想法吗?谢谢。 - shekeine
1
col 向量没被使用,对吧?能否请你将它删除掉? - Max Ghenis
@user2345448 你好,你应该使用国家ISO代码来关联map.world数据到其他来源,执行连接等操作,而不是使用国家名称 ;-). - shekeine
@user2345448,这里国家名称并不重要,因为它们只是用来生成随机向量的,从而定义地图颜色渐变,以回答OP的问题:这与您的问题不同。如果您需要关于rworldmap数据的帮助,请在SO上发布一个新问题或联系软件包作者,谢谢。 - shekeine
显示剩余3条评论

网页内容由stack overflow 提供, 点击上面的
可以查看英文原文,
原文链接