如何使用R绘制世界地图?

10

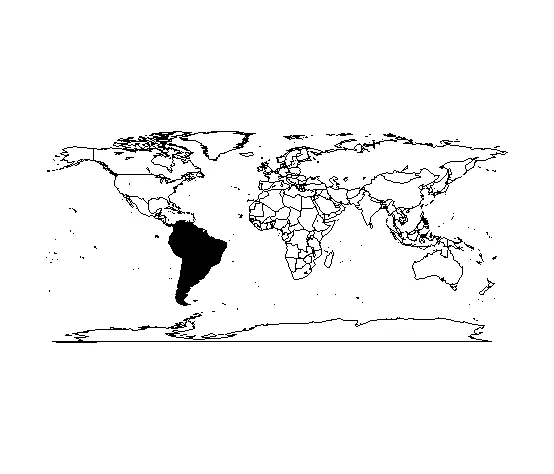
有许多解决方案可以在国家级别上绘制地图,但在我的情况下,我想在大陆级别上打印统计数据。

我能想到的唯一方法是使用国家级别的地图,并为每个大陆使用一个国家列表,但我想知道是否有任何简单的解决方案适用于这种地图。要实现我的想法,应该像这样:

## produce the world map
map()
## list of countries per continent
SA <- c("argentina", "bolivia", "brazil", "chile", "colombia", "ecuador", "guyana", "paraguay", "peru", "suriname", "uruguay", "venezuela")
map(regions = SA, fill=TRUE, add=TRUE)

世界地图


寻找大陆形状文件? 没有代码,这是一个关于工具/库的离题请求。 - Thomas
我正在寻求R代码来生成类似图片的东西。 - David Ameller
1
@David Ameller 最好发布一下你目前的代码。 - Kevin Dong
是的,正如@Thomas所说,第一步是为每个大陆找到一个shapefile(例如在gadm或naturalearth上查找)。然后代码很简单:您可以使用sp包中的readShapeSpatial加载shapefile,然后使用相当简单的plot绘制它们(需要maptools包来绘制shapefiles)。目前为止,由于您还没有展示您的代码,这不是一个编程问题。 - plannapus
1
好的,您可以在此找到大陆的形状文件:http://www.baruch.cuny.edu/geoportal/data/esri/world/continent.zip - plannapus
好的,放心,我马上就要放一些代码了,抱歉... :) - David Ameller
3个回答

15

rworldmap有绘制或聚合数据到区域级别(包括大陆)的函数。

以下简单步骤可以生成下面的图:

library(rworldmap)
#get coarse resolution world from rworldmap
sPDF <- getMap()  
#mapCountries using the 'continent' attribute  
mapCountryData(sPDF, nameColumnToPlot='continent')

或者按照7大洲模型:

mapCountryData(sPDF, nameColumnToPlot='REGION')

若要将您自己的数据从国家级汇总到地区级别,请查看:

?mapByRegion

rworldmap 大陆地图


你知道用你的方法是否可以得到7大洲模型吗?http://en.wikipedia.org/wiki/Continent - David Ameller
是的,你可以使用REGION属性代替:mapCountryData(sPDF, nameColumnToPlot='REGION')。我会把它加入到答案中。这也应该适用于@Josh出色的国家合并。 - Andy
我发现以下代码的输出对于理解在“mapByRegion”中提到但未详细说明的其他各种区域标识符非常有用:reg<- c("GEO3", "GEO3major", "IMAGE24", "GLOCAF", "Stern", "SRES", "SRESmajor","GBD","AVOIDname"); sapply( reg, function(x) table(sPDF@data[[x]])) - IRTFM

7
library(sp) #Load your libraries
library(maptools)
#Download the continents shapefile
download.file("http://baruch.cuny.edu/geoportal/data/esri/world/continent.zip",
              "cont.zip")
#Unzip it
unzip("cont.zip")
#Load it
cont <- readShapeSpatial("continent.shp")
#Plot it
plot(cont,
     col=c("white","black","grey50","red","blue","orange","green","yellow")) 
#Or any other combination of 8 colors

enter image description here


1
这个解决方案很好,但我发现生成的PDF太大了。另外,我发现从外部源下载形状文件有点繁琐(我也承认它有其他优点)。 - David Ameller

7

继 @Andy 的回答之后,你可以按以下方式合并每个大洲内的国家多边形:

library(rworldmap)
library(rgeos)
library(maptools)
library(cleangeo)  ## For clgeo_Clean()

sPDF <- getMap()
sPDF <- clgeo_Clean(sPDF)  ## Needed to fix up some non-closed polygons 
cont <-
    sapply(levels(sPDF$continent),
           FUN = function(i) {
               ## Merge polygons within a continent
               poly <- gUnionCascaded(subset(sPDF, continent==i))
               ## Give each polygon a unique ID
               poly <- spChFIDs(poly, i)
               ## Make SPDF from SpatialPolygons object
               SpatialPolygonsDataFrame(poly,
                                        data.frame(continent=i, row.names=i))
           },
           USE.NAMES=TRUE)

## Bind the 6 continent-level SPDFs into a single SPDF
cont <- Reduce(spRbind, cont)

## Plot to check that it worked
plot(cont, col=heat.colors(nrow(cont)))

## Check that it worked by looking at the SPDF's data.frame
## (to which you can add attributes you really want to plot on)
data.frame(cont)
#                   continent
# Africa               Africa
# Antarctica       Antarctica
# Australia         Australia
# Eurasia             Eurasia
# North America North America
# South America South America

enter image description here


谢谢Josh,你的贡献非常有帮助 :) - David Ameller
很高兴能够帮忙。每个“多边形”对象都应该有一个唯一的ID,并且“SPDF”的数据框的行名应该与这些ID匹配,这使得它足够棘手,以至于我认为我可能会将其记录下来供将来参考。 - Josh O'Brien
嗨,Josh,我能在Windows机器上运行您的示例,但是在Unix中使用不同版本的R和rgeos时无法运行。请查看此链接并提供建议...先行感谢..https://dev59.com/I53ha4cB1Zd3GeqPZsmi - Munish
@Munish -- 看起来自从这个答案最初发布以来,rgeos 对于非闭合多边形变得更加敏感了(或者至少这是我最好的猜测)。现在已经编辑了我的答案,包括调用 cleangeo::clgeo_Clean(),它可以修复这些问题。感谢您指出这些问题。 - Josh O'Brien
嗨Josh,抱歉打扰你,请看一下这个问题,可能是R和/或fields包的类似版本问题:https://dev59.com/2Z_ha4cB1Zd3GeqPsAM5 - Munish

网页内容由stack overflow 提供, 点击上面的
可以查看英文原文,
原文链接