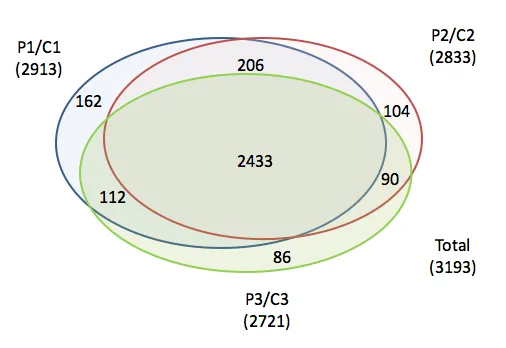
我有一组微阵列数据,想按照附图(用PowerPoint完成)进行表示。我尝试了R可用的各种软件包(VennDiagram、venneuler、limma),但无法按比例绘制数据或显示值。
请问是否有人知道如何实现?
以下是可供操作的代码!
谢谢!
请问是否有人知道如何实现?
以下是可供操作的代码!
谢谢!
# you might need these:
source("http://www.bioconductor.org/biocLite.R")
biocLite("limma")
library(VennDiagram)
library(limma)
library(venneuler)

# Trial 1: Kind of proportional but difficult to customize for labels and other stuff
su <- venneuler(c(A=162, B=104, C=86, "A&B"=206, "A&C"=112, "B&C"=90 ,"A&B&C"=2433))
plot(su)

# Trial 2: looks nice but not proportional
hw <- c(F,F,F,F,T,T,T,T)
hm <- c(F,F,T,T,F,F,T,T)
hr <- c(F,T,F,T,F,T,F,T)
c4 <- cbind(hw,hm,hr)
e <- vennCounts(c4)
e[1:8,4] <- c(3193,86,104,90,162,112,206,2433)
vennDiagram(e)
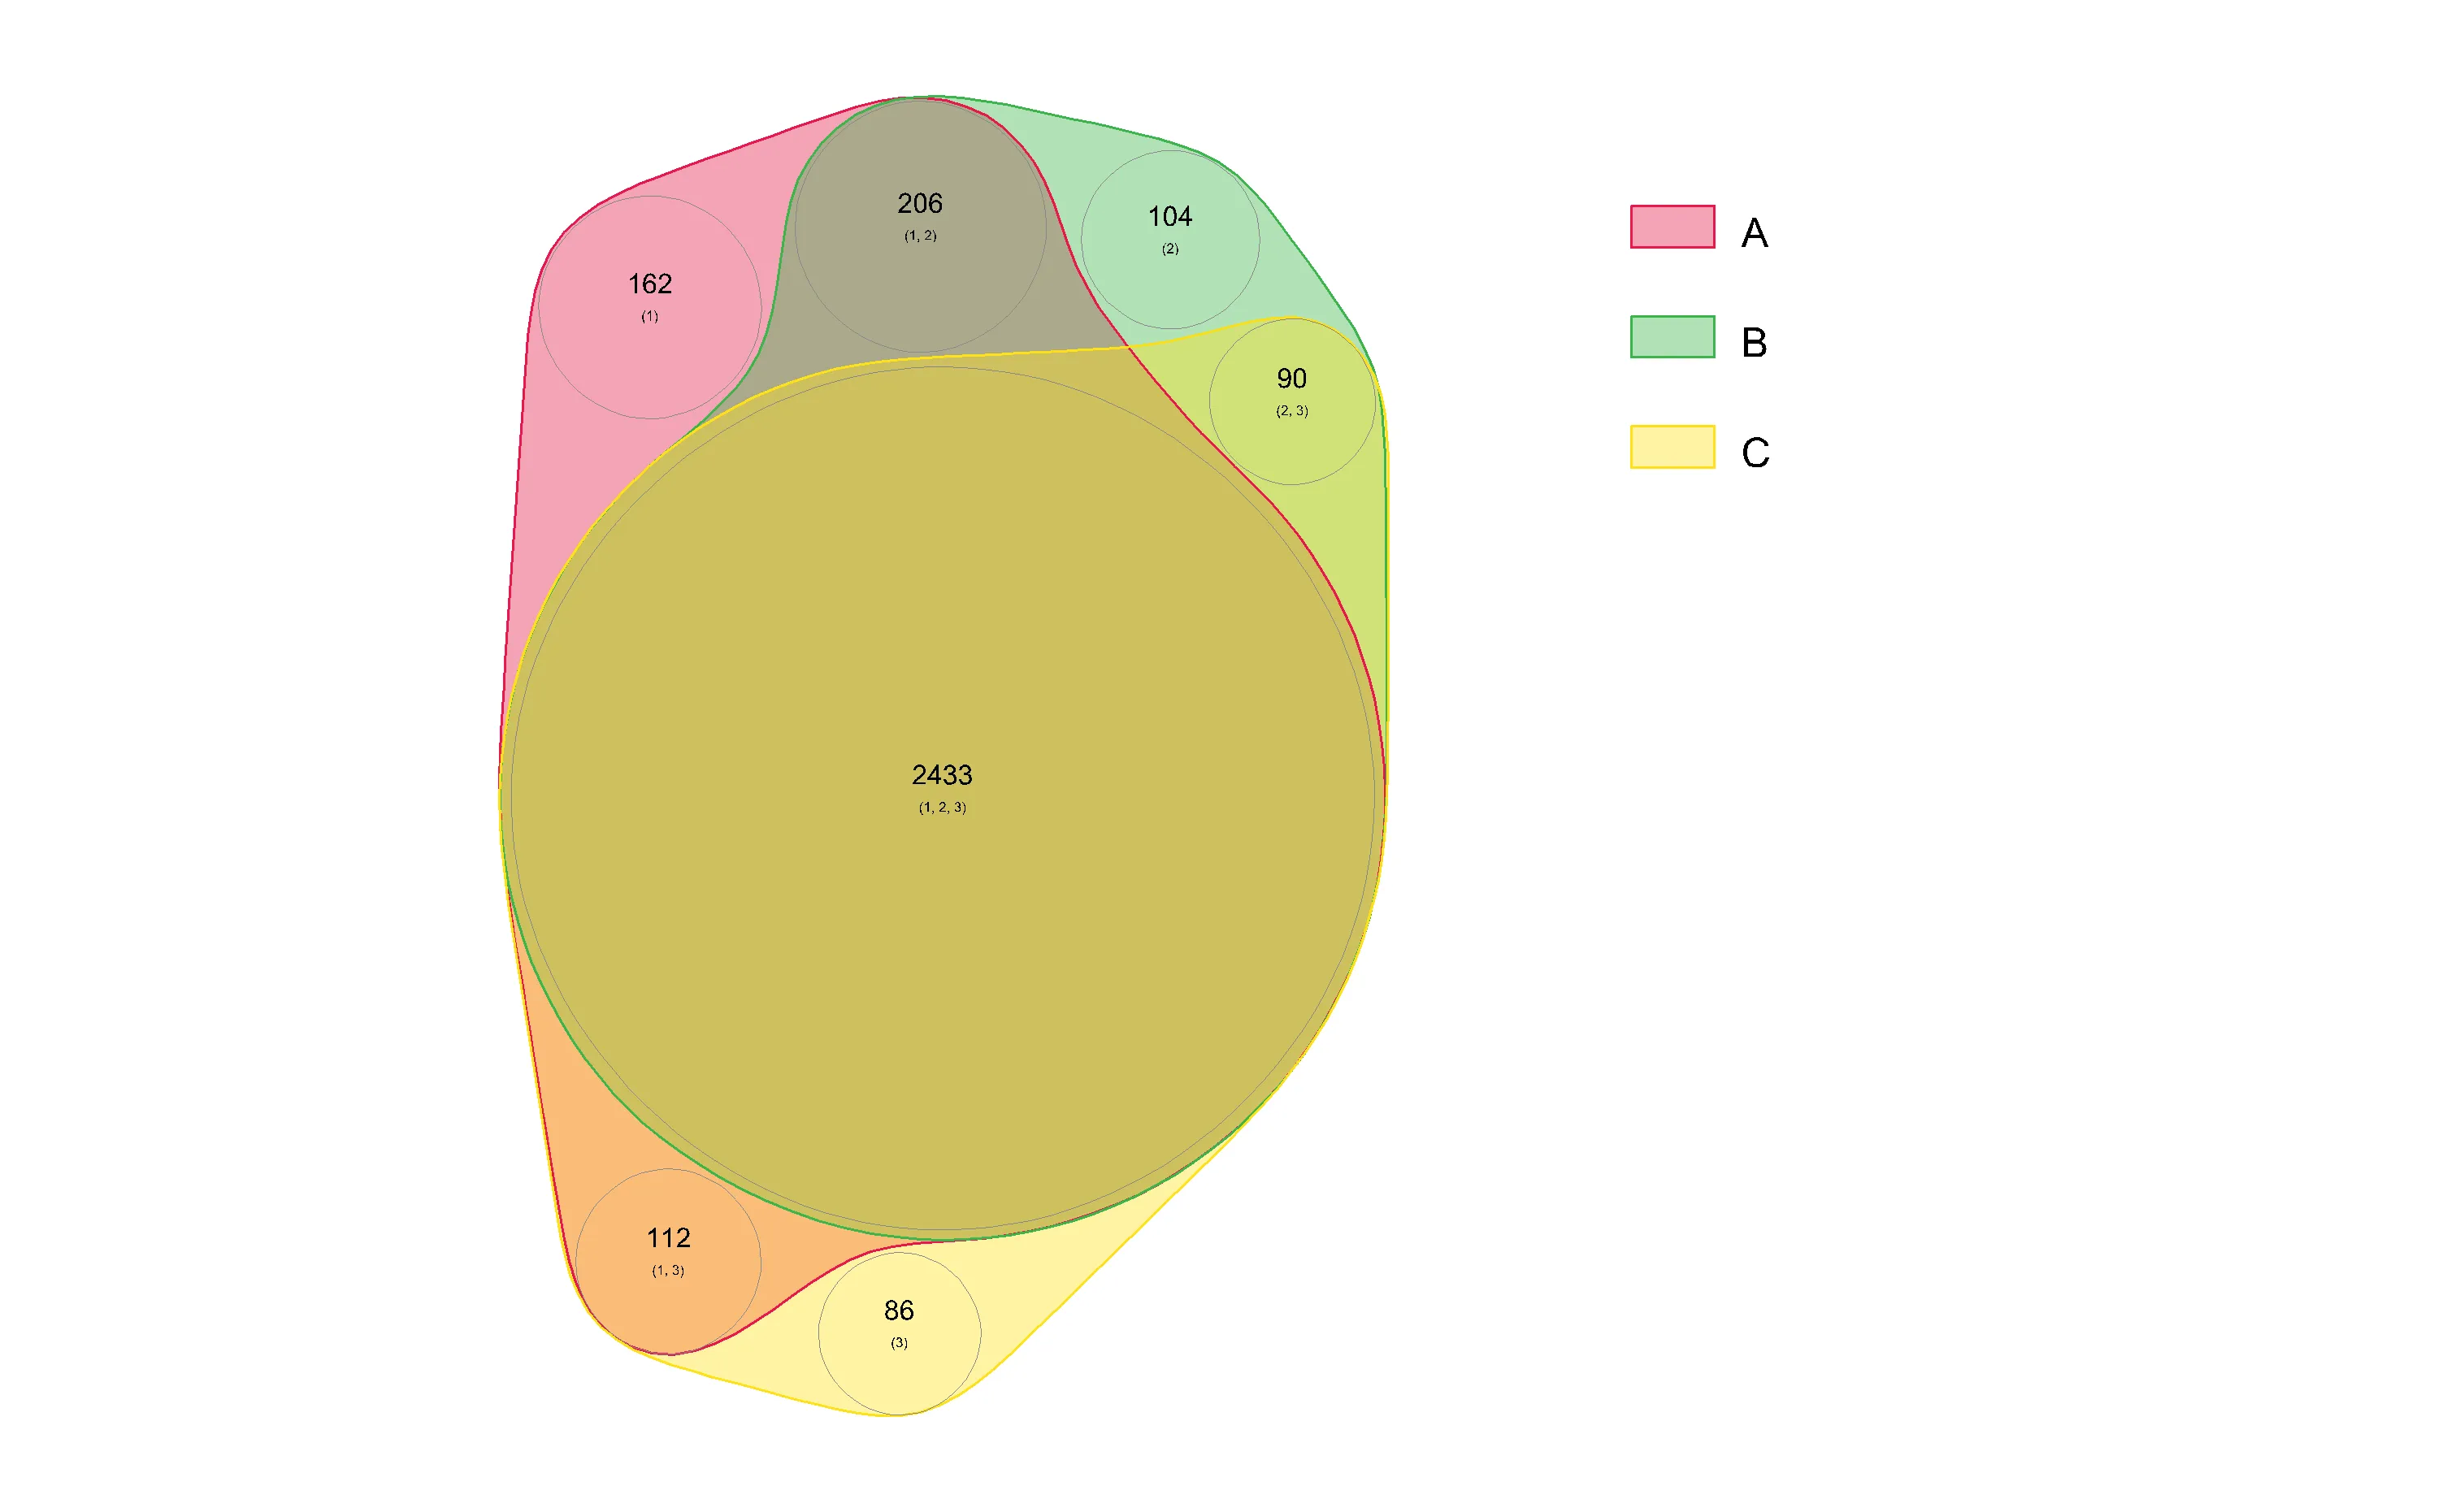
venneuler的文档非常差,但是你可以使用su$labels = c("Foo", "Bar", "Baz")修改标签,使用su$colors = c(0.1, 0.44, 0.3)修改颜色等。然而,我认为不可能使用圆形绘制三个集合的比例韦恩图。只有六个参数(三个半径和连接圆心的三条边),试图表示七个不同的区域。但是,使用其他形状(例如椭圆)可能是可能的。我发现 eulerAPE,但它对我来说效果很差。 - Sparhawk