我正在尝试使用 R 中的 eulerr 包创建一个缩放的 Venn 图。
我的代码如下:
plot(euler(c( "LUTS"=98, "Symptoms of UTI"=46, "Positive urine culture"=39,
              "Symptoms of UTI&LUTS"=33, "LUTS&Positive urine culture"=24,
              "Symptoms of UTI&Positive urine culture"=22, "Symptoms of UTI&LUTS&Positive urine culture"=18),
           input = "union", shape = "ellipse"), key = TRUE, counts = TRUE,
     quantities = list(type = c("counts", "percent"), font=3, round=2, cex=0.8),
     fills =list(fill=c(viridis::plasma(n = 3))), alpha = 0.3, c("#1957FF", "#FF750C", "#FF220C"), alpha = 0.3,
     edges=list(lty = 1), factor_names = TRUE, labels=list(font=2, cex=1), legend = FALSE)
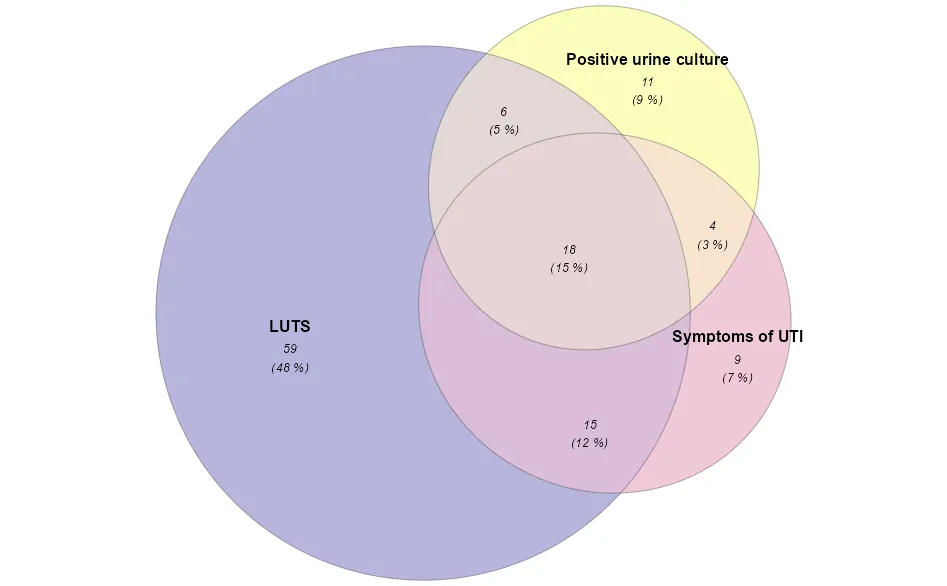
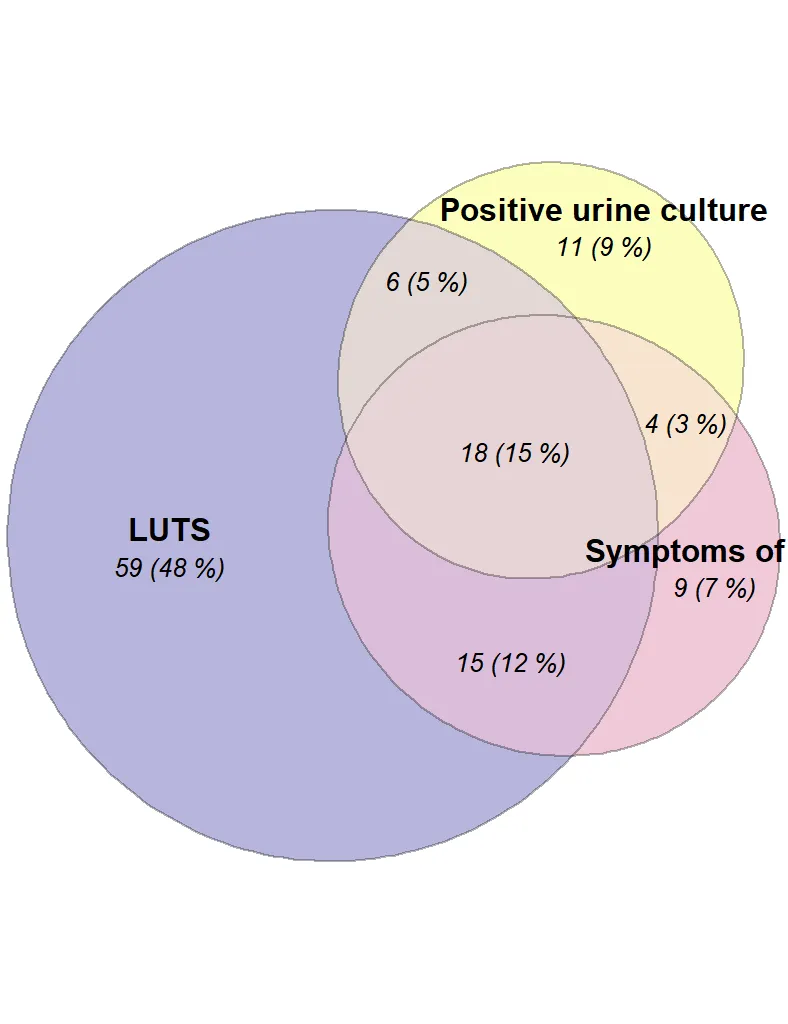
输出结果:
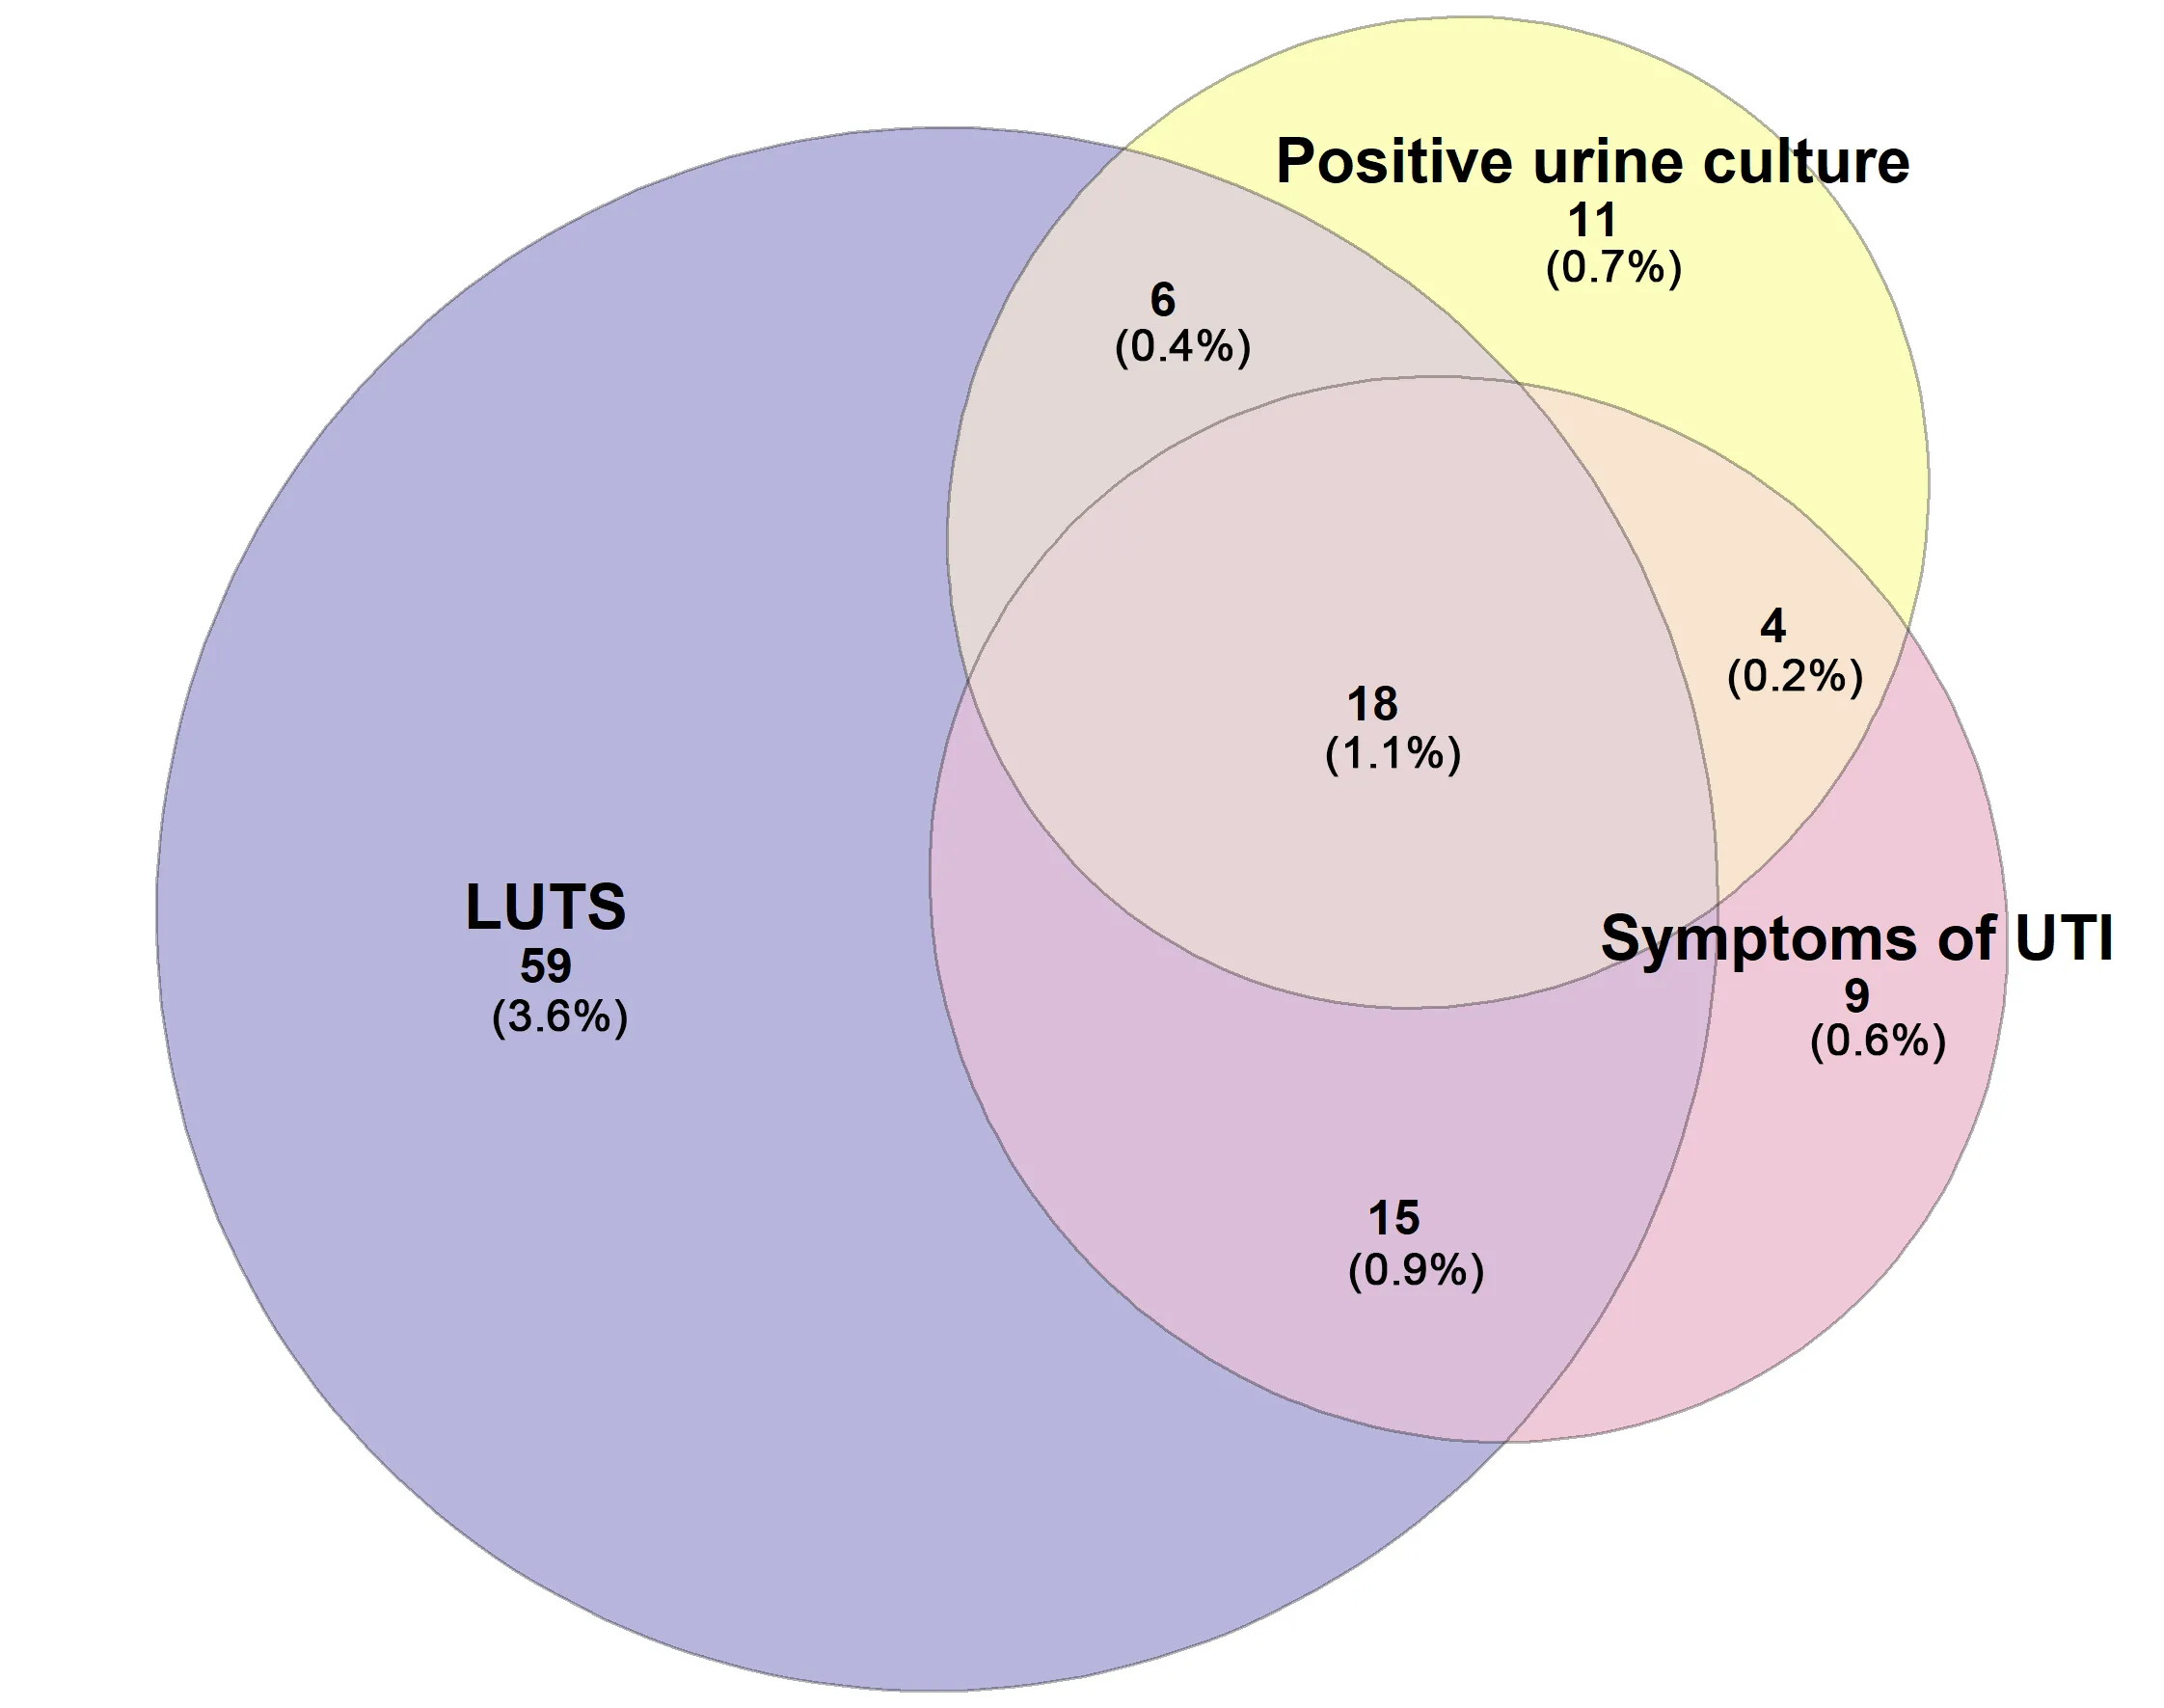
 我如何让百分比值在计数值下面打印出来?类似这样: