如何修改 facet_wrap 标题条的宽度?

3
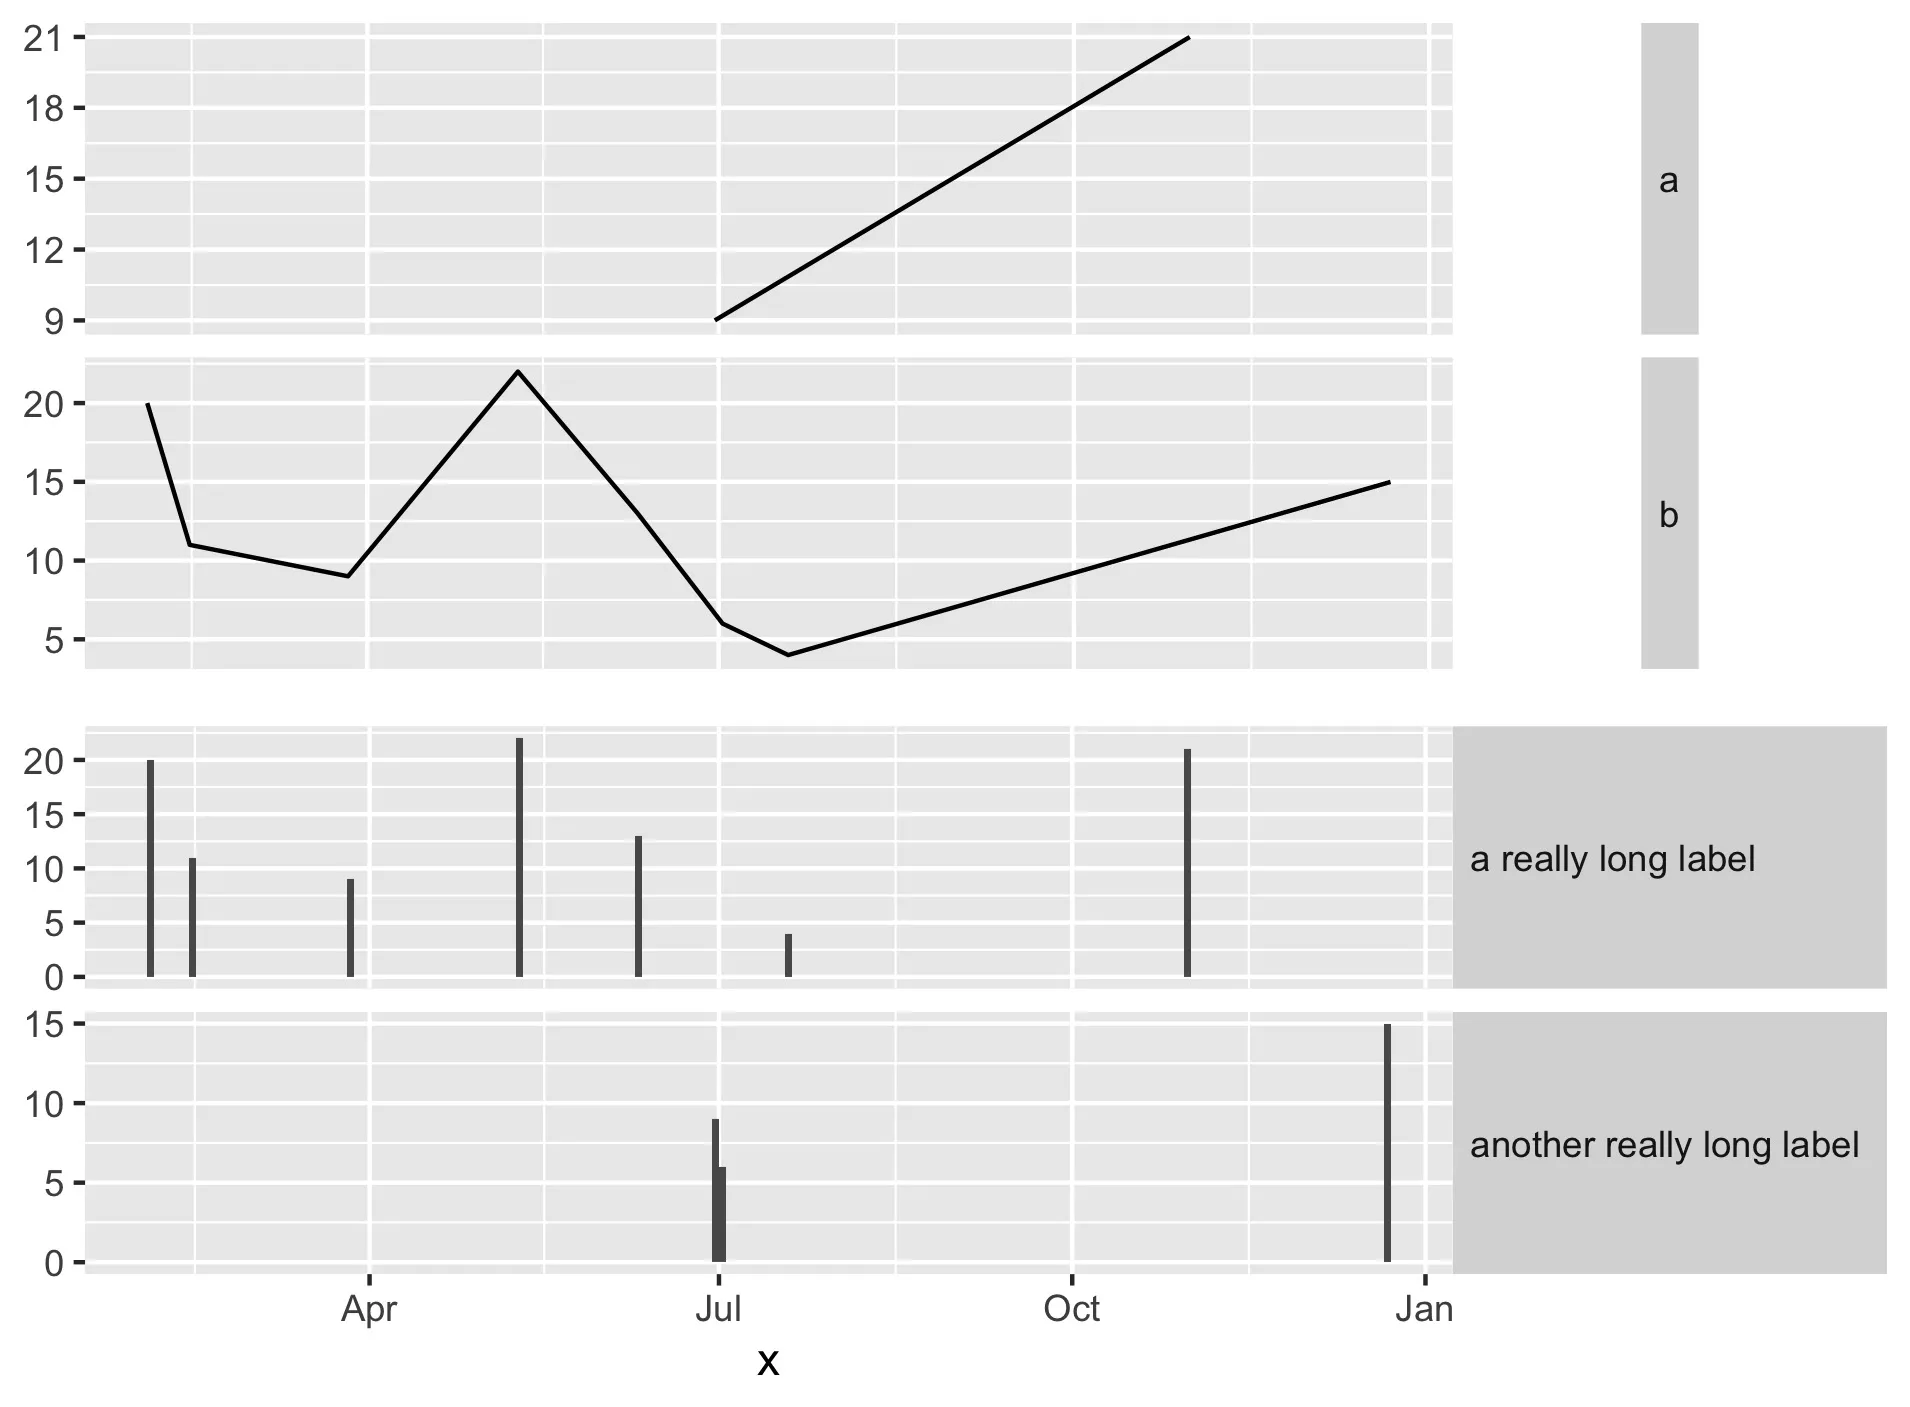
我有两个图表:FigA和FigB。它们都是分面包装的。FigA是基于短因子标签进行分面的,而FigB是基于较长的因子标签进行分面的。FigA和FigB都共享一个x轴,因此我想通过cowplot垂直显示它们,条纹标签位于绘图的右侧,并带有水平文本。这会导致FigA的短条纹标签周围出现大量空白区域。

Example strip label white space

什么是格式化条形标签背景的最佳方法,以便它们可以扩展到填充可用的水平空间?
我一直在尝试使用strip.background和strip.text边距、大小和其他参数进行实验,但目前还没有达到预期的结果。我是否遗漏了一些明显的东西?
以下是一个最小示例
(我意识到我可能可以使用pivot_longer并使用这个简单的示例生成一个单独的图表,但是否有一种直接修改条形标签以适应更复杂情况的方法?):
library(tidyverse)
library(cowplot)
df <- data.frame(   shortCat = sample(c('a','b'), 10, replace=TRUE),
                    longCat = sample(c('a really long label','another really long label'), 10, replace=TRUE),
                    x = sample(seq(as.Date('2020/01/01'), as.Date('2020/12/31'), by="day"), 10),
                    y = sample(0:25, 10, replace = TRUE) )

figA <- df %>% ggplot( aes(x=x,y=y) ) +      
    geom_line() + 
    facet_wrap(vars(shortCat), ncol=1, strip.position ="right", scales="free_y") + 
    theme(  axis.title.y=element_blank(),
            axis.title.x=element_blank(),
            axis.text.x=element_blank(),
            axis.ticks.x=element_blank(), 
            strip.text.y.right = element_text(angle = 0, hjust=0) )

figB <- df %>% ggplot( aes(x=x,y=y) ) +      
    geom_bar(stat="identity") + 
    facet_wrap(vars(longCat), ncol=1, strip.position ="right", scales="free_y") + 
    theme(  axis.title.y=element_blank(),
            strip.text.y.right = element_text(angle = 0, hjust=0) )

plot_grid(figA,figB, ncol=1, align="v")
1个回答

0

对于需要堆叠两个独立图形的情况,以下是一种匹配条带宽度的方法:

  • 加载ggtext包,该包允许我们在单个条带标签中使用多种文本颜色(使用html标签)。
  • 获取最长条带标签的完整文本。将其作为第二行添加到短条带标签中(我们将添加一个html标签来实现此操作)。这段文本将确保两个图形的条带宽度完全相同。
  • 然而,我们不希望额外的文本行可见。因此,我们将添加一些html标签来将此文本的颜色设置为与条带的背景填充颜色相同。
library(tidyverse)
library(patchwork) # For plot layout
library(ggtext) # For multiple text colors in strip labels
theme_set(theme_bw())

set.seed(2)
df <- data.frame(shortCat = sample(c('a','b'), 10, replace=TRUE),
                 longCat = sample(c('a really long label','another really long label'), 10, replace=TRUE),
                 x = sample(seq(as.Date('2020/01/01'), as.Date('2020/12/31'), by="day"), 10),
                 y = sample(0:25, 10, replace = TRUE) )

# Test method's robustness by making labels of different lengths
df = df %>% 
  mutate(shortCat2 = gsub("b", "medium label", shortCat))

# Get text of longest label
pad = df$longCat[which.max(nchar(df$longCat))]

# Get colour of strip background
txt.col = theme_get()$strip.background$fill

# Set padding text to same colour as background, so it will be invisible
#  (you can set the color to "white" for a visual confirmation of what this does)
df$shortCat2 = paste0(df$shortCat2,  "<span style = 'color:",txt.col,";'><br>", pad ,"</span>")

figA = df %>%
  ggplot( aes(x=x,y=y) ) +
  geom_line() +
  facet_wrap(vars(shortCat2), ncol=1, strip.position ="right", scales="free_y") +
  theme(axis.title.y=element_blank(),
        axis.title.x=element_blank(),
        axis.text.x=element_blank(),
        axis.ticks.x=element_blank(),
        strip.text.y=element_textbox())

figA / figB

这里有另一种方法,我们通过添加空格来扩展带状标签到所需的宽度。它需要等宽字体,这使得它不太灵活,但它不需要像前一种方法中那样使用html标签。

# Identify monospaced fonts on your system
fonts = systemfonts::system_fonts()
fonts %>% filter(monospace) %>% pull(name)
#>  [1] "Menlo-Bold"                "Courier-Oblique"          
#>  [3] "Courier-BoldOblique"       "AppleBraille"             
#>  [5] "AppleBraille-Pinpoint8Dot" "AndaleMono"               
#>  [7] "Menlo-BoldItalic"          "Menlo-Regular"            
#>  [9] "CourierNewPS-BoldMT"       "AppleBraille-Outline6Dot" 
#> [11] "GB18030Bitmap"             "Monaco"                   
#> [13] "AppleBraille-Outline8Dot"  "PTMono-Regular"           
#> [15] "PTMono-Bold"               "AppleColorEmoji"          
#> [17] "Menlo-Italic"              "CourierNewPS-ItalicMT"    
#> [19] "Courier"                   "Courier-Bold"             
#> [21] "CourierNewPSMT"            "AppleBraille-Pinpoint6Dot"
#> [23] "CourierNewPS-BoldItalicMT"

# Set theme to use a monospace font
theme_set(theme_bw() + 
            theme(text=element_text(family="Menlo-Regular")))

figA <- df %>%
  mutate(shortCat = paste0(shortCat, 
                           paste(rep(" ", max(nchar(longCat)) - 1), collapse=""))
  ) %>%
  ggplot( aes(x=x,y=y) ) +
  geom_line() +
  facet_wrap(vars(shortCat), ncol=1, strip.position ="right", scales="free_y") +
  theme(axis.title.y=element_blank(),
        axis.title.x=element_blank(),
        axis.text.x=element_blank(),
        axis.ticks.x=element_blank(),
        strip.text.y.right = element_text(angle = 0, hjust=0))

figB <- df %>% ggplot( aes(x=x,y=y) ) +
  geom_line() +
  facet_wrap(vars(longCat), ncol=1, strip.position ="right", scales="free_y") +
  theme(  axis.title.y=element_blank(),
          strip.text.y.right = element_text(angle = 0, hjust=0) )

figA / figB

如果您可以将数据重塑为长格式并制作单个图形,那就是最直接的方法:
theme_set(theme_bw())

df %>% 
  pivot_longer(matches("Cat")) %>% 
  mutate(value = fct_relevel(value, "a", "b")) %>% 
  ggplot(aes(x,y)) +
  geom_line() +
  facet_wrap(~value, ncol=1, strip.position="right") +
  theme(strip.text.y=element_text(angle=0, hjust=0))


谢谢@eipi10,这非常有用。我会看一下的。那么我可以确认没有主题支持以我正在尝试的方式操纵条带背景吗? - Andy Harvey
我不知道有没有一种方法可以在不篡改条形谱的情况下设置绝对条宽。但是,我在我的答案中添加了一种新的方法作为第二个选项。这有点像黑客行为,但我认为它足够灵活,可以在相对通用的情况下使用。 - eipi10
1
谢谢 @eipi10,太棒了!我稍微修改了我的问题,以使合并图而不是重塑数据可能是首选选项更加清晰,以防这会激发其他解决方法。但总的来说,感谢您提供如此完整的选项! - Andy Harvey
不客气!鉴于您的问题更新,我已将两个组合独立绘图选项移至顶部,而单一绘图选项则移至底部。 - eipi10

网页内容由stack overflow 提供, 点击上面的
可以查看英文原文,
原文链接