如何自动调整facet_wrap每个面的宽度?

27

我想使用ggplot2绘制箱线图,并且我有多个facet,每个facet都有不同的术语,如下所示:

library(ggplot2)

  p <- ggplot(
    data=Data,
    aes(x=trait,y=mean)
    )

  p <- p+facet_wrap(~SP,scales="free",nrow=1)

  p <- p+geom_boxplot(aes(fill = Ref,
    lower = mean - sd, 
    upper = mean + sd, 
    middle = mean, 
    ymin = min, 
    ymax = max,
    width=c(rep(0.8/3,3),rep(0.8,9))),
    lwd=0.5,
    stat="identity")

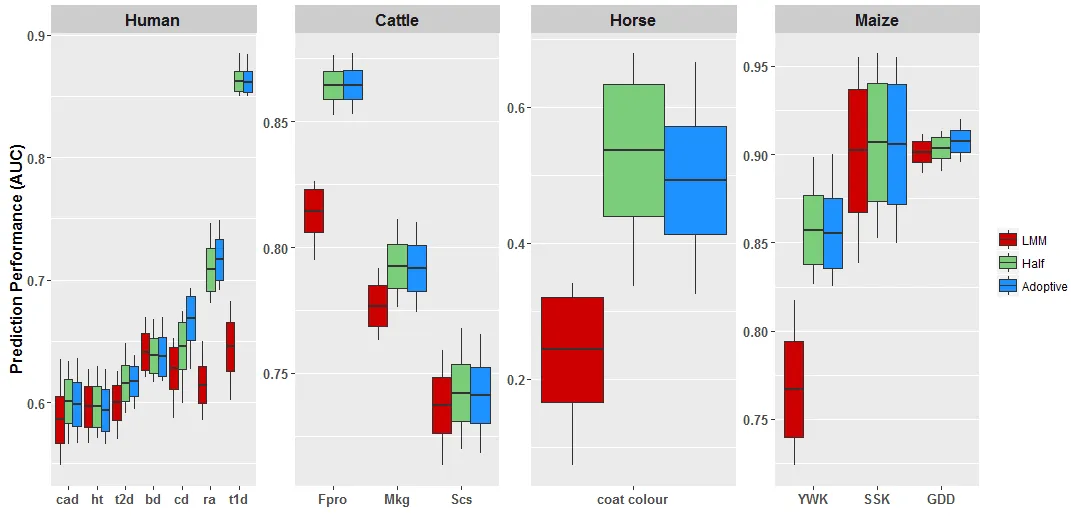
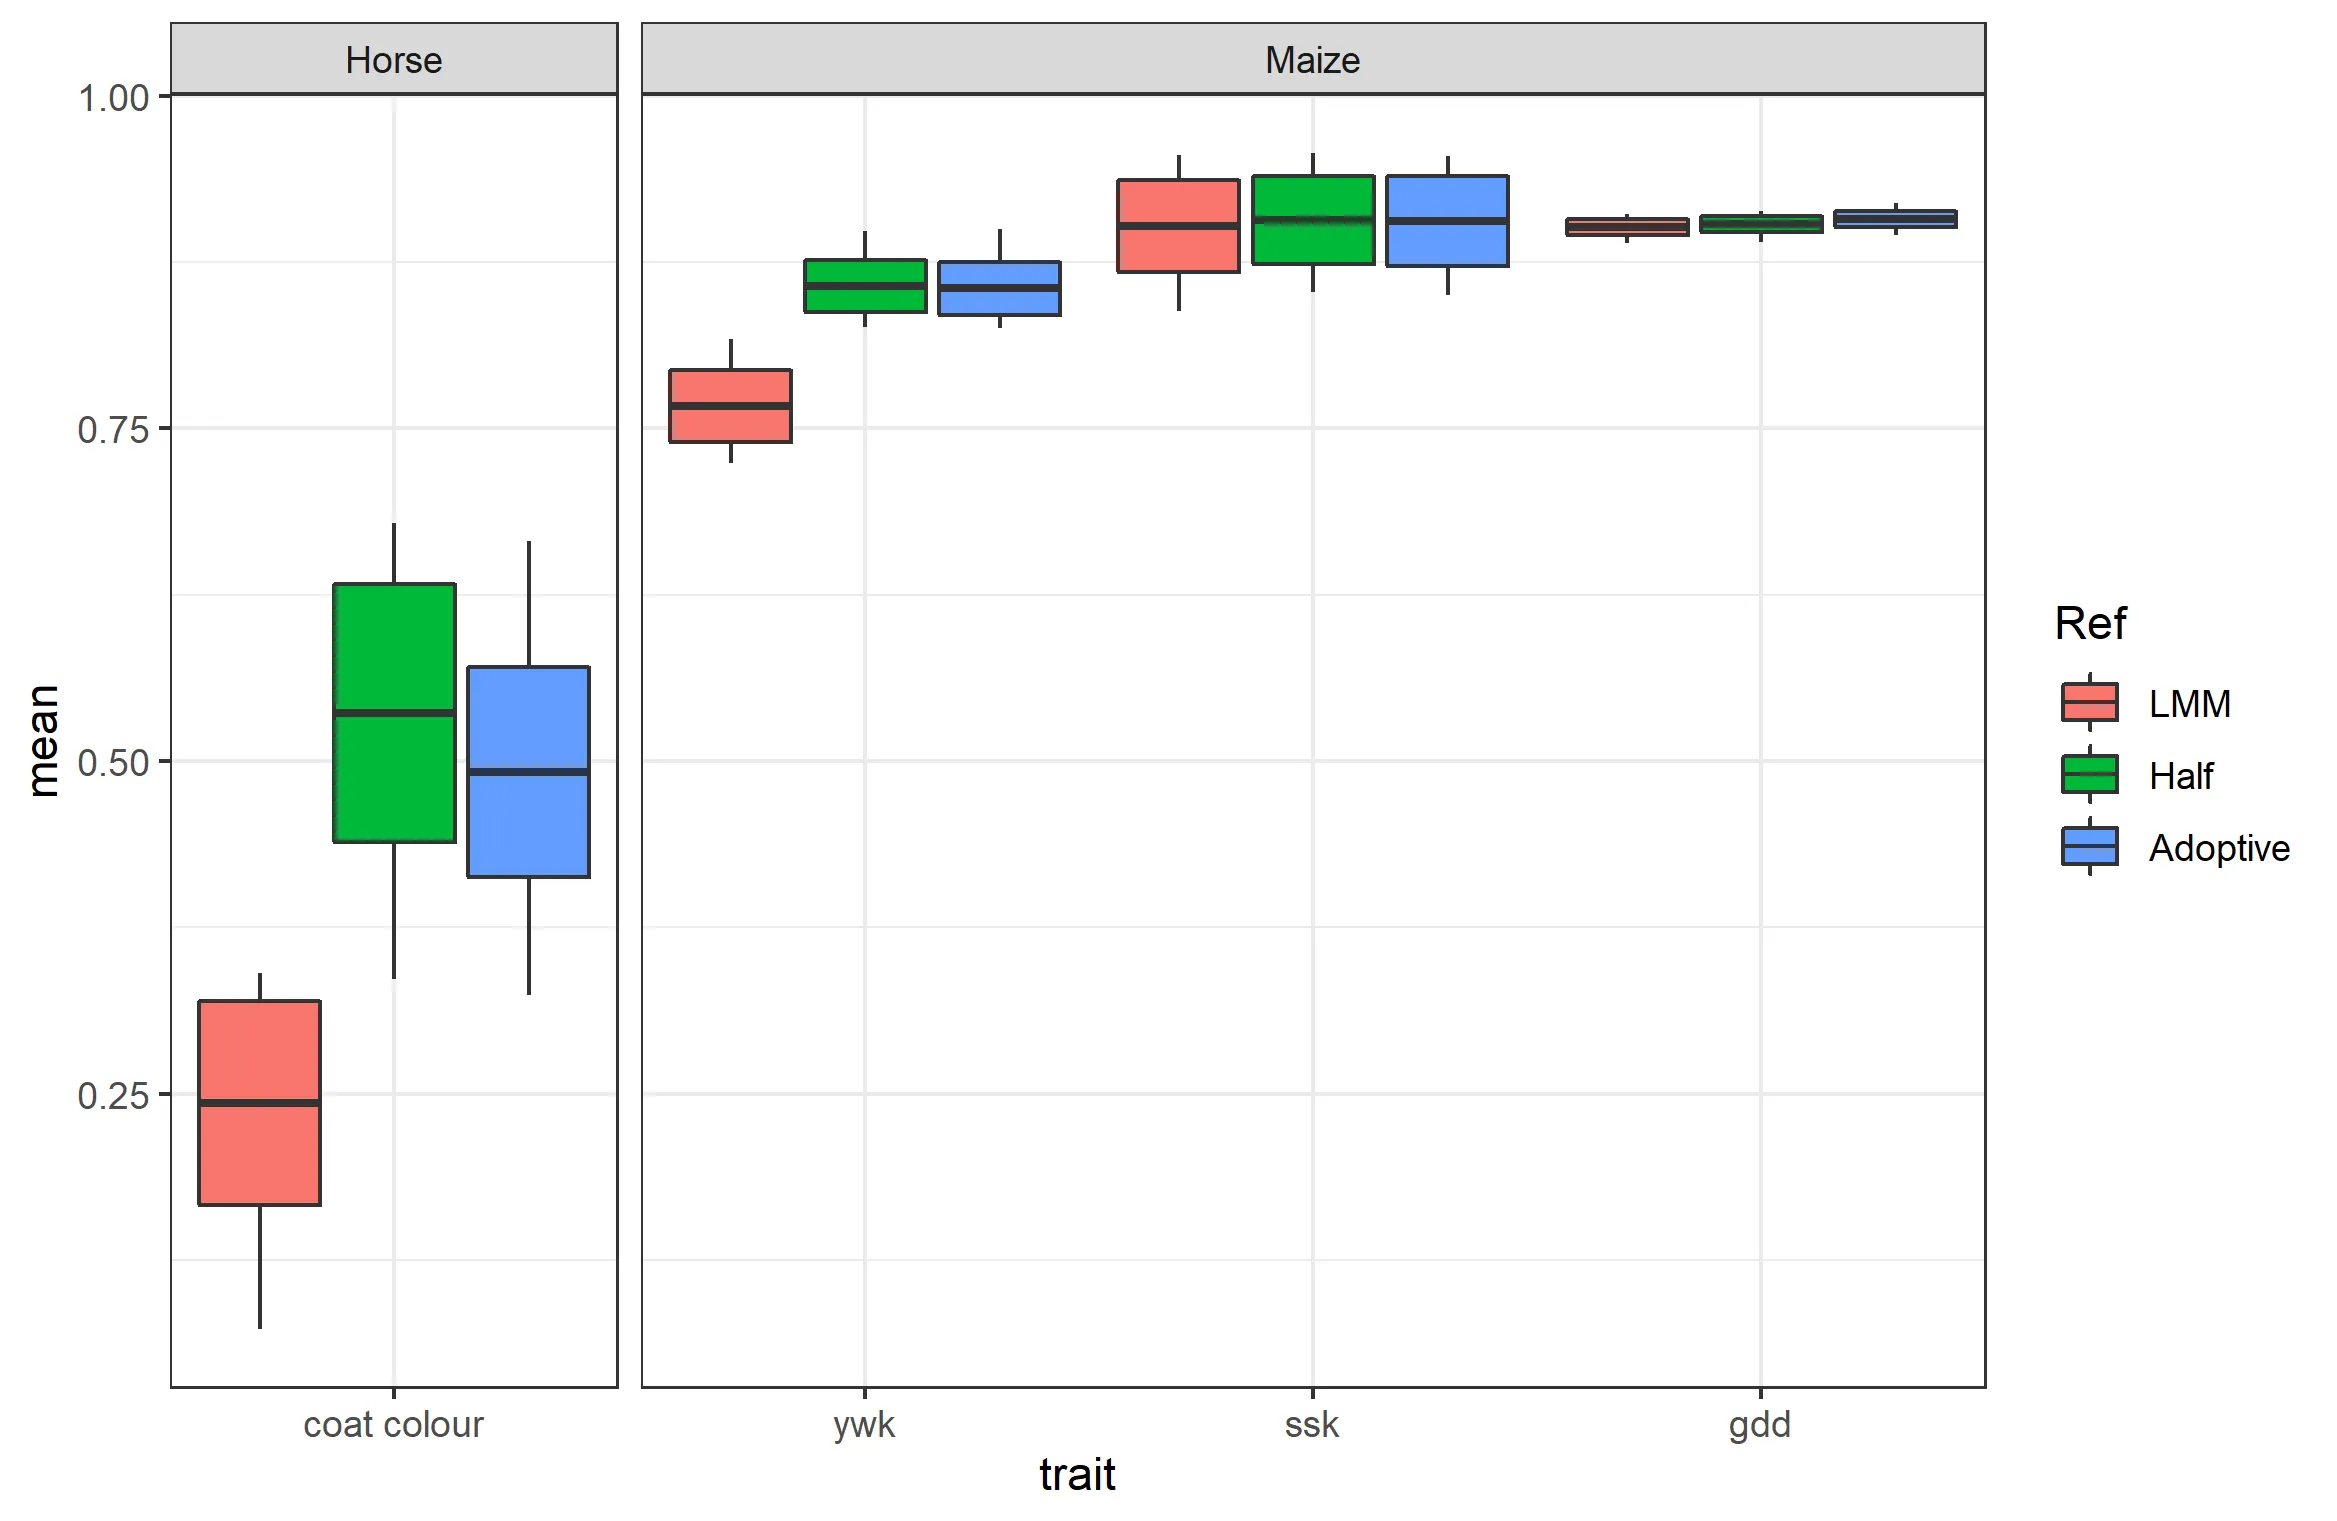
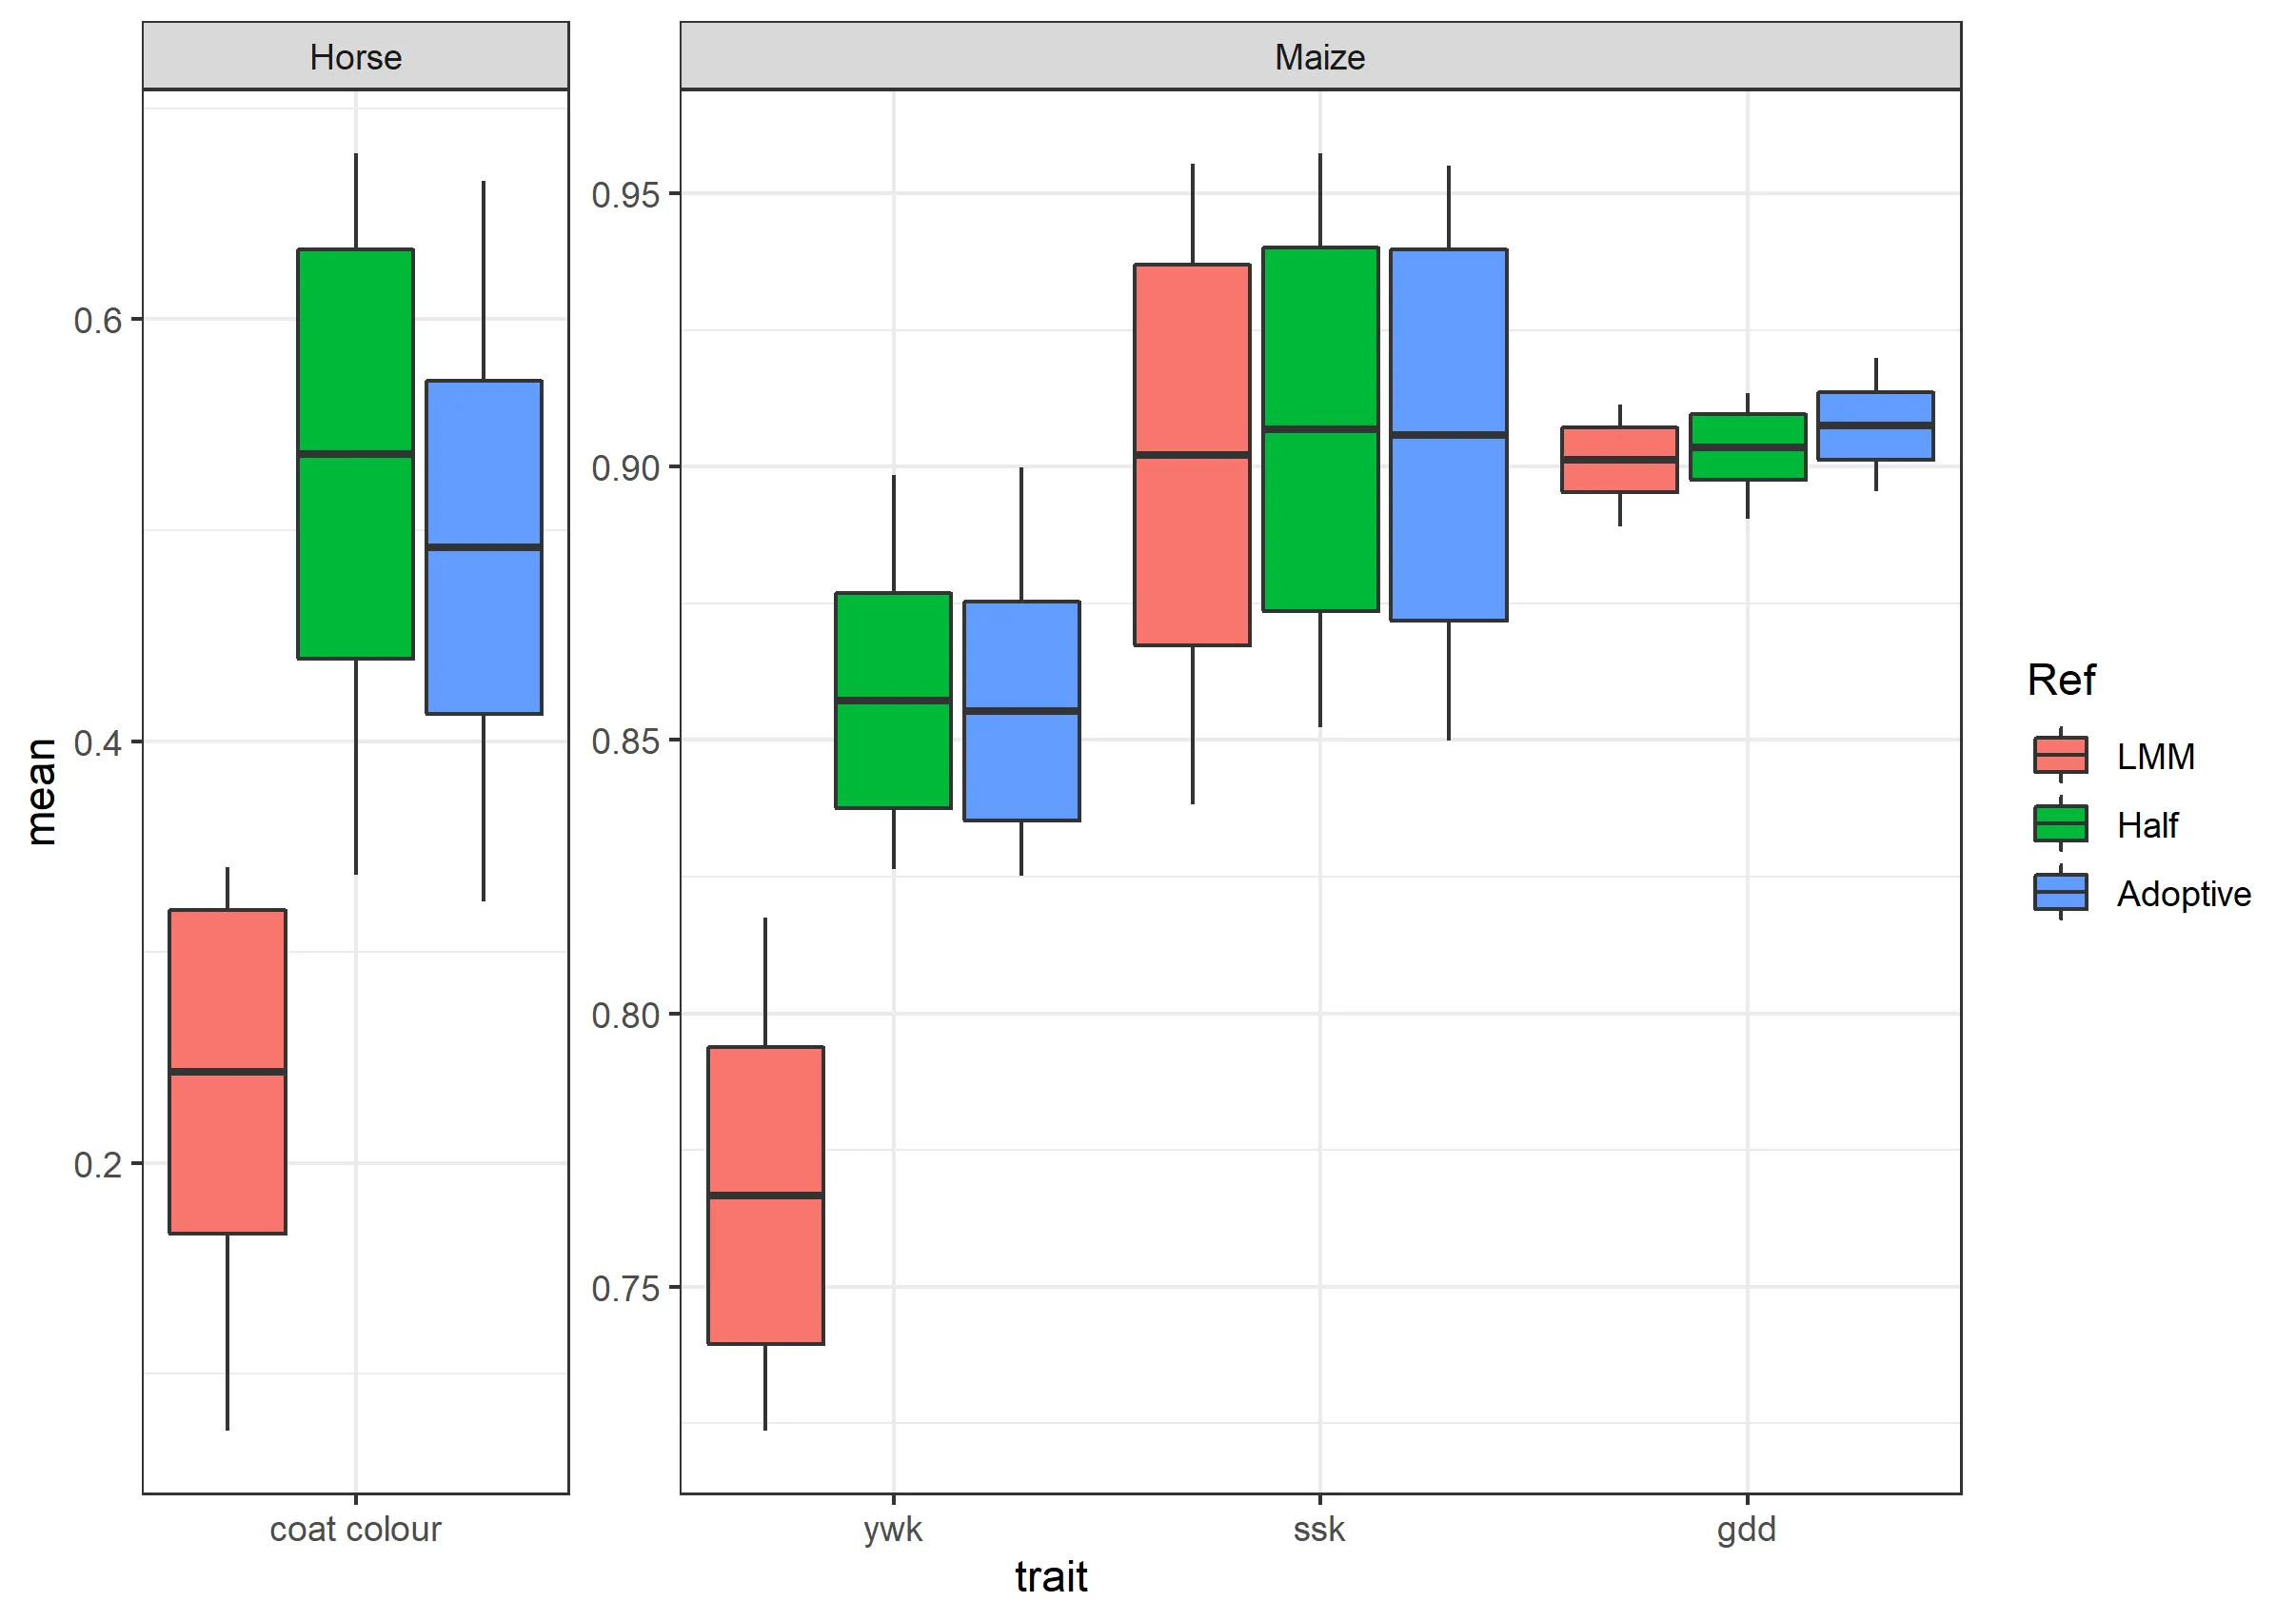
如图所示,不同分面中方框的宽度不同,有没有办法将所有方框调整为相同大小?我尝试使用facet_grid,它可以自动更改分面的宽度,但所有分面共享相同的y轴。


Data

Data <- structure(list(SP = structure(c(3L, 3L, 3L, 4L, 4L, 4L, 4L, 4L, 
    4L, 4L, 4L, 4L), .Label = c("Human", "Cattle", "Horse", "Maize"
    ), class = "factor"), Ref = structure(c(3L, 2L, 1L, 3L, 3L, 3L, 
    2L, 2L, 2L, 1L, 1L, 1L), .Label = c("LMM", "Half", "Adoptive"
    ), class = "factor"), trait = structure(c(11L, 11L, 11L, 14L, 
    13L, 12L, 14L, 13L, 12L, 14L, 13L, 12L), .Label = c("cad", "ht", 
    "t2d", "bd", "cd", "ra", "t1d", "fpro", "mkg", "scs", "coat colour", 
    "ywk", "ssk", "gdd"), class = "factor"), min = c(0.324122039, 
    0.336486555, 0.073152049, 0.895455441, 0.849944623, 0.825248005, 
    0.890413591, 0.852385351, 0.826470308, 0.889139116, 0.838256672, 
    0.723753592), max = c(0.665536838, 0.678764774, 0.34033228, 0.919794865, 
    0.955018001, 0.899903826, 0.913350912, 0.957305688, 0.89843716, 
    0.911257005, 0.955312678, 0.817489555), mean = c(0.4919168555, 
    0.5360103372, 0.24320509565, 0.907436221, 0.9057516121, 0.8552899502, 
    0.9035394117, 0.9068819173, 0.8572309823, 0.90125638965, 0.90217769835, 
    0.7667208778), sd = c(0.0790133656517775, 0.09704320004497, 0.0767552215753863, 
    0.00611921020505611, 0.0339614482273291, 0.0199389195311925, 
    0.00598633573504195, 0.0332634006653858, 0.0196465508521771, 
    0.00592476494699222, 0.0348144156099722, 0.0271827880539459)), .Names = c("SP", 
    "Ref", "trait", "min", "max", "mean", "sd"), class = "data.frame", row.names =                 c(10L, 
    11L, 12L, 34L, 35L, 36L, 37L, 38L, 39L, 40L, 41L, 42L))
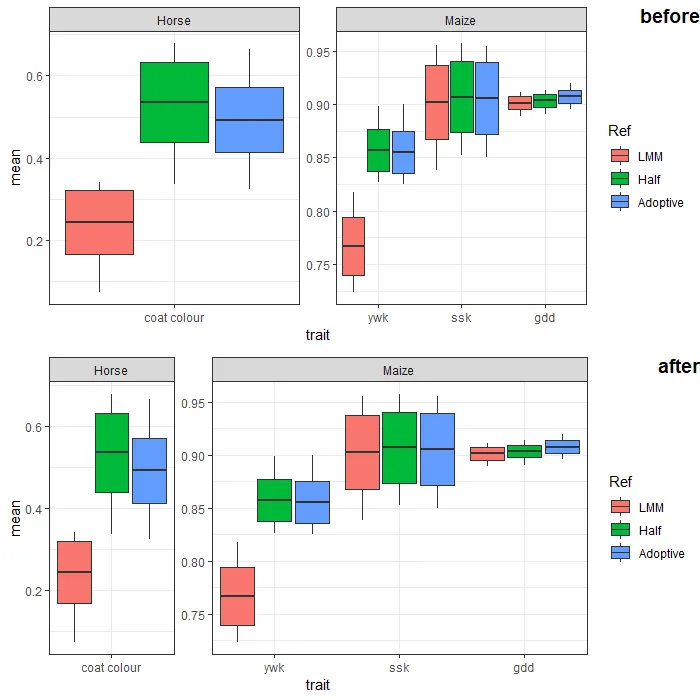
3个回答

52

虽然 u/z-lin 的回答是可行的,但有一个更简单的解决方案。将 facet_wrap(...) 切换为使用 facet_grid(...)。使用 facet_grid,您不需要指定行和列。您仍然可以指定 scales=(如果需要,允许自动调整每个面板的轴比例),但您还可以指定 space=,它具有相同的作用,但与整个面板宽度的比例缩放。这正是您想要的。现在,您的函数调用类似于:

ggplot(Data, aes(x = trait, y = mean)) +
    geom_boxplot(aes(
        fill = Ref, lower = mean-sd, upper = mean+sd, middle = mean, 
        ymin = min, ymax = max),
        lwd = 0.5, stat = "identity") +
    facet_grid(. ~ SP, scales = "free", space='free') +
    scale_x_discrete(expand = c(0, 0.5)) +
    theme_bw()

这里输入图像描述

可以在 这里 找到有关分面布局的更多说明。

正如@cdtip所提到的那样,这不允许为每个分面使用独立的y轴刻度,这是OP最初要求的。 幸运的是,也有一个简单的解决方案,它利用了ggforce包中的facet_row()

library(ggforce)

# same as above without facet_grid call..
p <- ggplot(Data, aes(x = trait, y = mean)) +
  geom_boxplot(aes(
    fill = Ref, lower = mean-sd, upper = mean+sd, middle = mean, 
    ymin = min, ymax = max),
    lwd = 0.5, stat = "identity") +
  scale_x_discrete(expand = c(0, 0.5)) +
  theme_bw()

p + ggforce::facet_row(vars(SP), scales = 'free', space = 'free')

在这里输入图片描述


1
你真是个救星!谢谢你! - MokeEire
1
这个解决方案可能会帮助一些人,但我想指出的是,这个答案并没有以任何方式解决原始帖子,并且这不是OP所寻找的。YinLL说过考虑了facet_grid,但facet_grid解决方案要求所有分面共享相同的y轴。还希望有一个可变的y轴比例尺,但在当前的facet_grid实现中,这是不可能的,正如你的图表所反映的那样。 - cdtip
3
@cdtip说得好。我刚刚注意到ggforce完全实现了space=scales=的使用,因此您可以像OP想要的那样使用facet_row()。请重新检查答案并编辑。 - chemdork123
2
@chemdork123,非常棒的编辑。感谢您回复我的评论,我之前不知道ggforce包。非常有帮助。 - cdtip

25

将 ggplot 对象转换为 grob 后,您可以调整面板宽度:

# create ggplot object (no need to manipulate boxplot width here. 
# we'll adjust the facet width directly later)
p <- ggplot(Data,
       aes(x = trait, y = mean)) +
  geom_boxplot(aes(fill = Ref,
                   lower = mean - sd, 
                   upper = mean + sd, 
                   middle = mean, 
                   ymin = min, 
                   ymax = max),
               lwd = 0.5,
               stat = "identity") +
  facet_wrap(~ SP, scales = "free", nrow = 1) +
  scale_x_discrete(expand = c(0, 0.5)) + # change additive expansion from default 0.6 to 0.5
  theme_bw()

# convert ggplot object to grob object
gp <- ggplotGrob(p)

# optional: take a look at the grob object's layout
gtable::gtable_show_layout(gp)

# get gtable columns corresponding to the facets (5 & 9, in this case)
facet.columns <- gp$layout$l[grepl("panel", gp$layout$name)]

# get the number of unique x-axis values per facet (1 & 3, in this case)
x.var <- sapply(ggplot_build(p)$layout$panel_scales_x,
                function(l) length(l$range$range))

# change the relative widths of the facet columns based on
# how many unique x-axis values are in each facet
gp$widths[facet.columns] <- gp$widths[facet.columns] * x.var

# plot result
grid::grid.draw(gp)

plot comparison


1
非常感谢您的帮助!这是我问题的最佳答案! - YinLL
@Z.Lin 你好,有没有办法将 grid::grid.draw(gp) 转换成 ggplot2 对象? - Miao Cai
@MiaoCai 一般来说,我不这么认为。你可能希望在这里阅读讨论:https://dev59.com/q18d5IYBdhLWcg3wvkON - Z.Lin
@Z.Lin 谢谢! - Miao Cai

-3
通常情况下,您可以在ggplot中确定箱线图的宽度,方法如下:
ggplot(data= df, aes(x = `some x`, y = `some y`)) + geom_boxplot(width = `some witdth`)

在您的情况下,您可以考虑将所有箱线图的宽度设置为x范围除以最大元素数量(在最左边的图中)。

嗨!非常感谢您的帮助!按照您的建议,它确实有效。我已经成功地将所有框调整为相同的宽度,但另一个问题是如何调整每个面板的宽度?因为在facet_wrap的默认情况下,所有面板的宽度都是相等的。 - YinLL
facet_wrap有一个参数scales:应该固定比例尺(“fixed”,默认值),自由比例尺(“free”)还是在一个维度上自由比例尺(“free_x”,“free_y”)。如果您喜欢我的答案,我会很高兴如果您能给它点赞;) - Omry Atia
1
请问您能否使用 dput(head(your data frame, 10)) 命令将您的数据框上传,最好不要上传整个数据框,这样我们可以更好地处理它。同时也请提供您绘图的代码。参考链接:https://dev59.com/eG025IYBdhLWcg3whGSx - tjebo
我尝试了参数"scales=free",但对于facet_wrap无效,所有分面的宽度始终相等。我在第二个答案中提供了一个小例子,请试一试,谢谢! - YinLL

网页内容由stack overflow 提供, 点击上面的
可以查看英文原文,
原文链接