我正在使用ggplot2来制作箱线图。
然而,我无法更改stat_boxplot(geom ='errorbar')的宽度。
这是我的代码的一部分:
geom_boxplot(width=0.5)+stat_boxplot(geom ='errorbar',width=0.5)
geom_boxplot() 没问题,但是 stat_boxplot(geom='errorbar') 的宽度没有改变。
有什么建议吗?谢谢!
我正在使用ggplot2来制作箱线图。
然而,我无法更改stat_boxplot(geom ='errorbar')的宽度。
这是我的代码的一部分:
geom_boxplot(width=0.5)+stat_boxplot(geom ='errorbar',width=0.5)
geom_boxplot() 没问题,但是 stat_boxplot(geom='errorbar') 的宽度没有改变。
有什么建议吗?谢谢!
要调整胡须线的大小(宽度),我们可以在函数stat_boxplot内使用参数stat_params = list(width = 0.5)。
library(ggplot2)
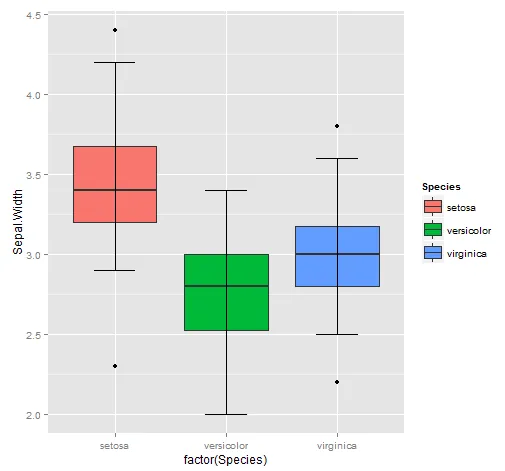
ggplot(iris, aes(factor(Species), Sepal.Width, fill = Species)) +
geom_boxplot() +
stat_boxplot(geom ='errorbar', stat_params = list(width = 0.5)) +
Update
Now we can use the argument width inside stat_boxplot
library(ggplot2)
ggplot(iris, aes(factor(Species), Sepal.Width, fill = Species)) +
  geom_boxplot() +
  stat_boxplot(geom ='errorbar', width = 0.5)
stat_boxplot有一个width参数。 - mt1022