如何绘制带有水平排序误差条的图表(带有误差标记的排序条形图)?

6

我希望能够绘制均值和标准误差的横向条形图,并且我希望这些均值按顺序排列。

我已经找到了使用lattice绘制横向有序条形图的方法,但是我不知道如何添加误差线标记。以下是我的数据和我想出来的R代码。

data <- structure(c(0.67, 0.67, 0.76, 0.66, 0.71, 0.6, 0.52, 0.6, 0.71, 0.76, 
0.76, 0.71, 0.6, 0.61, 0.9, 0.5, 0.58, 0.84, 0.68, 0.88,
0.89, 0.96, 1, 0.95, 1, 1, 0.98, 0.78, 0.98, 1, 
1, 0.99, 1, 1, 0.95, 0.92, 1, 0.91, 1, 0.87, 
0.91, 0.72, 0.73, 0.55, 0.82, 0.87, 0.64, 0.75, 0.75, 1, 
0.81, 0.79, 1, 0.74, 0.57, 0.84, 1, 0.95, 0.78, 0.95), .Dim = c(20L, 3L), .Dimnames = list(
    c("1", "2", "3", "4", "5", "6", "7", "8", "9", "10", "11", 
    "12", "13", "14", "15", "16", "17", "18", "19", "20"), c("A", 
    "B", "C")))

means <- apply(data, 2, mean)

errors <- apply(data, 2, sd)

plot.data <- data.frame(colnames(data), means, errors)

colnames(plot.data) <- c("var", "mean", "error")

library("lattice")
plot.new()

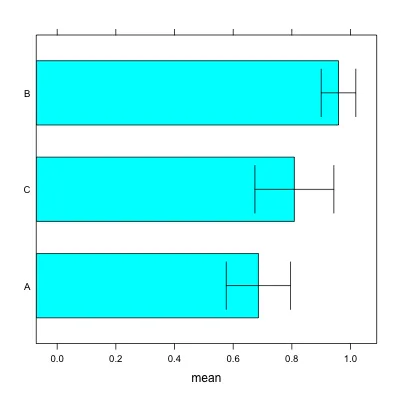
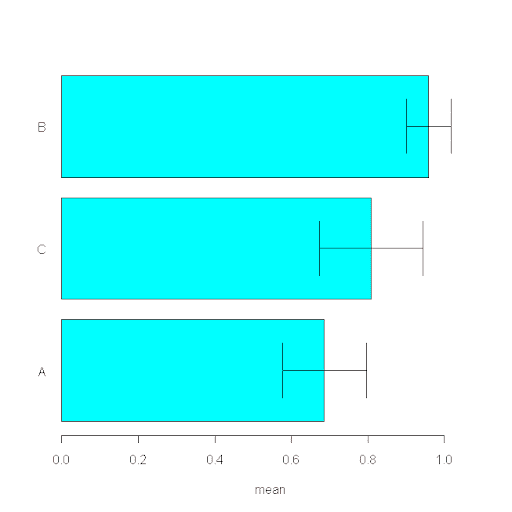
barchart(reorder(var, mean) ~ mean, plot.data, xlim = c(0, 1))

有没有办法在这个图表上添加错误标记?如果没有,您有什么建议可以在R中绘制我想要的图表吗?
提前感谢你!
2个回答

7

请参见 R-Help:在格子图中添加误差条

prepanel.ci <- function(x, y, lx, ux, subscripts, ...) {
    x <- as.numeric(x)
    lx <- as.numeric(lx[subscripts])
    ux <- as.numeric(ux[subscripts])
    list(xlim = range(0, x, ux, lx, finite = TRUE))
}


panel.ci <- function(x, y, lx, ux, subscripts, ...) {
    x <- as.numeric(x)
    y <- as.numeric(y)
    lx <- as.numeric(lx[subscripts])
    ux <- as.numeric(ux[subscripts])
    panel.barchart(x, y, ...)
    panel.arrows(lx, y, ux, y, col = 'black',
                 length = 0.25, unit = "native",
                 angle = 90, code = 3)
}

p <- barchart(reorder(var, mean) ~ mean, data=plot.data,
              lx=plot.data$mean-plot.data$error,
              ux=plot.data$mean+plot.data$error,
              panel=panel.ci,
              prepanel=prepanel.ci)
print(p)

lattice barchart with error bar


5

如果这里不必使用格子图,可以使用基本的R功能来实现一个简单的函数,该函数需要三个参数:条形图的宽度(xv),误差线的长度(up和down)以及y轴上的标签(nn)。请参考以下代码:

error.bars<-function(xv,z,nn){
par(las = 1)
yv <- barplot(xv,horiz = TRUE,col="cyan",xlim=c(0,(max(xv)+max(z))),names=nn,xlab=deparse(substitute(xv)))
g <- (max(yv)-min(yv))/(3*length(yv)) 
for (i in 1:length(yv)) {
lines(c(xv[i]+z[i],xv[i]-z[i]),c(yv[i],yv[i]))
lines(c(xv[i]+z[i],xv[i]+z[i]),c(yv[i]+g,yv[i]-g))
lines(c(xv[i]-z[i],xv[i]-z[i]),c(yv[i]+g,yv[i]-g))
}}

plot.data <- plot.data[order(plot.data$mean),] # reorder data
mean<-as.vector(plot.data$mean)
se<-as.vector(plot.data$error)
labels<-as.character(plot.data$var)

error.bars(mean,se,labels)

alt text


网页内容由stack overflow 提供, 点击上面的
可以查看英文原文,
原文链接