Matplotlib上的多个网格

17

我正在使用Python和matplotlib制作图表,迄今为止,我发现它们非常强大和灵活。

唯一我找不到如何做的事情是让我的图表具有多个网格。我查看了文档,但那只是关于线条样式的...

我想要的是两个图表,每个图表都有不同的网格,并且它们会重叠在一起。

例如,我想要制作这张图:

Alt text http://img137.imageshack.us/img137/2017/waittimeprobability.png
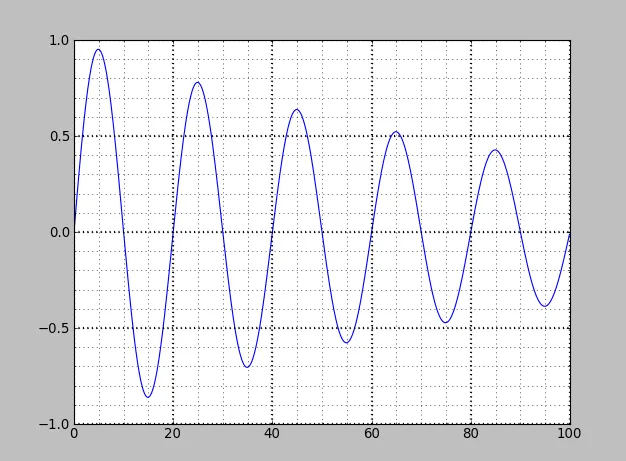
具有类似于这张图的网格标记:

Alt text http://img137.imageshack.us/img137/6122/saucelabssauceloadday.png

也就是说,在重要点之间有更频繁的网格和浅色。


似乎您正在寻找次要刻度。 - SilentGhost
1个回答

33

这个示例可以参考一下(改编自这里):

from pylab import *
from matplotlib.ticker import MultipleLocator, FormatStrFormatter

t = arange(0.0, 100.0, 0.1)
s = sin(0.1*pi*t)*exp(-t*0.01)

ax = subplot(111)
plot(t,s)

ax.xaxis.set_major_locator(MultipleLocator(20))
ax.xaxis.set_major_formatter(FormatStrFormatter('%d'))
ax.xaxis.set_minor_locator(MultipleLocator(5))

ax.yaxis.set_major_locator(MultipleLocator(0.5))
ax.yaxis.set_minor_locator(MultipleLocator(0.1))

ax.xaxis.grid(True,'minor')
ax.yaxis.grid(True,'minor')
ax.xaxis.grid(True,'major',linewidth=2)
ax.yaxis.grid(True,'major',linewidth=2)

show()

enter image description here


这似乎正是我正在寻找的!我会今天尝试并在它起作用后标记你的答案。谢谢。 - Santi

网页内容由stack overflow 提供, 点击上面的
可以查看英文原文,
原文链接