有没有一种惯用的方法来为两个类别的特征绘制直方图呢?在pandas中,我基本上需要
df.feature[df.class == 0].hist()
df.feature[df.class == 1].hist()
在同一个情节中。我可以做到。
df.feature.hist(by=df.class)
但这样会给我两个单独的图。
这似乎是一项常见任务,所以我想象中应该有一种惯用的方法来完成这个任务。当然,我可以手动操作直方图,使它们相邻,但通常 pandas 可以很好地做到这一点。
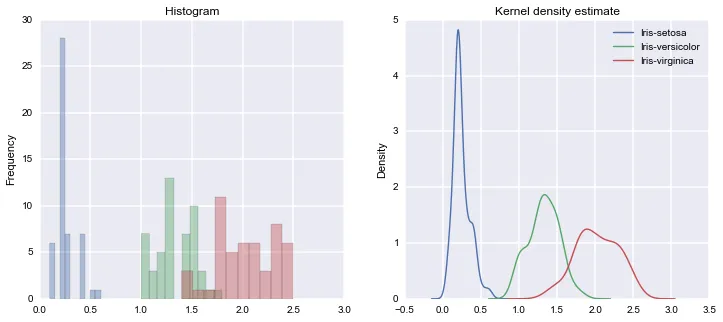
基本上,我希望将这个 Matplotlib 示例在一行 Pandas 中实现:http://matplotlib.org/examples/pylab_examples/barchart_demo.html
我以为我错过了什么,但也许现在还不可能。
fig, axs = plt.subplots(ncols=2)生成的 matplotlib 坐标轴列表。请参阅文档:http://matplotlib.org/users/recipes.html#easily-creating-subplots - jmzrange=[df.PetalWidth.min(), df.PetalWidth.max()]。 - Piotr Migdalaxs [1] .legend()可能是在那个示例中使用的。 - jmzaxs[1].legend()complains about no handles if used on the histogram. For the KDE plot you can passlegend=True- Danielle Madeley