1个回答
2
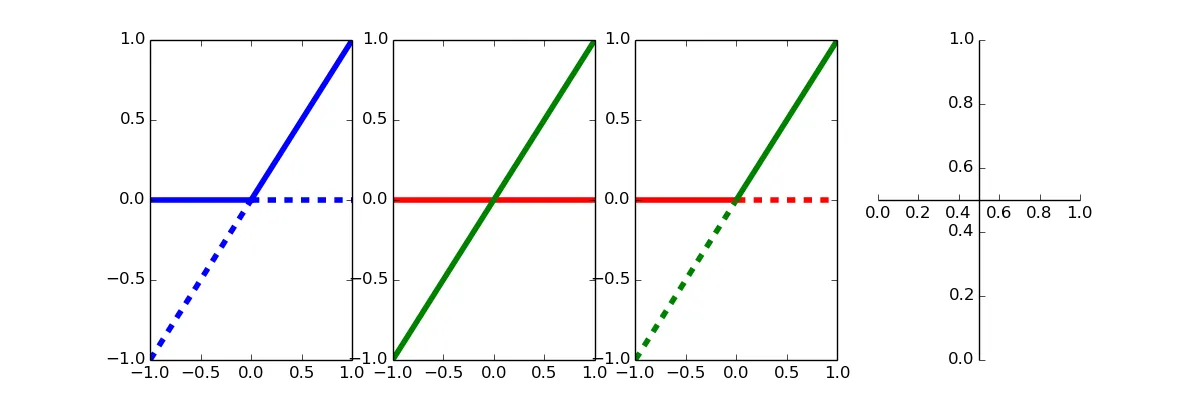
以下是我整理的4个不同示例,它们展示了不同的内容:
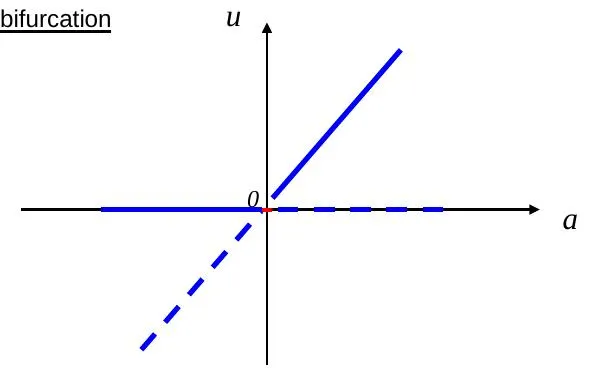
- 重新创建你问题中图形最简单的方法。请注意,每条线仅由两个点定义。
- 这是我假设你拥有的:两个x和y向量分别定义每条线(在我的示例中,它们各自有100个值)。
- 对于你来说,这是最有趣的(我猜):向量
solid1和solid2用于选择满足条件的x和y值。 - 只是为了向你展示如何将脊柱放在中心位置(因为你问题中的图形已经居中了)。
代码:
import numpy as np
import matplotlib.pyplot as plt

plt.figure(figsize=(12,4))

# Example 1
plt.subplot(1,4,1)
line1 = np.array([[-1,0],[0,0]])
line2 = np.array([[0,0],[1,1]])
line3 = np.array([[-1,-1],[0,0]])
line4 = np.array([[0,0],[1,0]])
plt.plot(line1[:,0], line1[:,1], 'b', linewidth=4)
plt.plot(line2[:,0], line2[:,1], 'b', linewidth=4)
plt.plot(line3[:,0], line3[:,1], 'b--', linewidth=4)
plt.plot(line4[:,0], line4[:,1], 'b--', linewidth=4)

# Example 2
plt.subplot(1,4,2)
x1 = np.linspace(-1,1,100)
x2 = np.linspace(-1,1,100)
y1 = x1*0
y2 = x2
plt.plot(x1,y1,'r', linewidth=4)
plt.plot(x2,y2,'g', linewidth=4)

# Example 3
plt.subplot(1,4,3)
#some sort of split condition:
solid1 = x1<0
solid2 = x2>0
#plot each line in two seperate plot calls
plt.plot(x1[solid1], y1[solid1], 'r', linewidth=4)
plt.plot(x1[np.logical_not(solid1)], y1[np.logical_not(solid1)], 'r--', linewidth=4)
plt.plot(x2[solid2], y2[solid2], 'g', linewidth=4)
plt.plot(x2[np.logical_not(solid2)], y2[np.logical_not(solid2)], 'g--', linewidth=4)

# Example 4
plt.subplot(1,4,4)
# put the spines to the middle
ax = plt.gca()
ax.spines['left'].set_position('center')
ax.spines['right'].set_color('none')
ax.spines['bottom'].set_position('center')
ax.spines['top'].set_color('none')
ax.spines['left'].set_smart_bounds(True)
ax.spines['bottom'].set_smart_bounds(True)
ax.xaxis.set_ticks_position('bottom')
ax.yaxis.set_ticks_position('left')

plt.show()
- hitzg
网页内容由stack overflow 提供, 点击上面的可以查看英文原文,
原文链接
原文链接
plt.plot(x[below], y1[below], 'b--')这行代码的作用是什么。 - Ohmbelow是一个bool向量,用于选择仅当below为True时x和y中的值。 - hitzg