在pandas/matplotlib中更改特定线条的线宽

11
我正在绘制一个类似这样的数据框的图表。
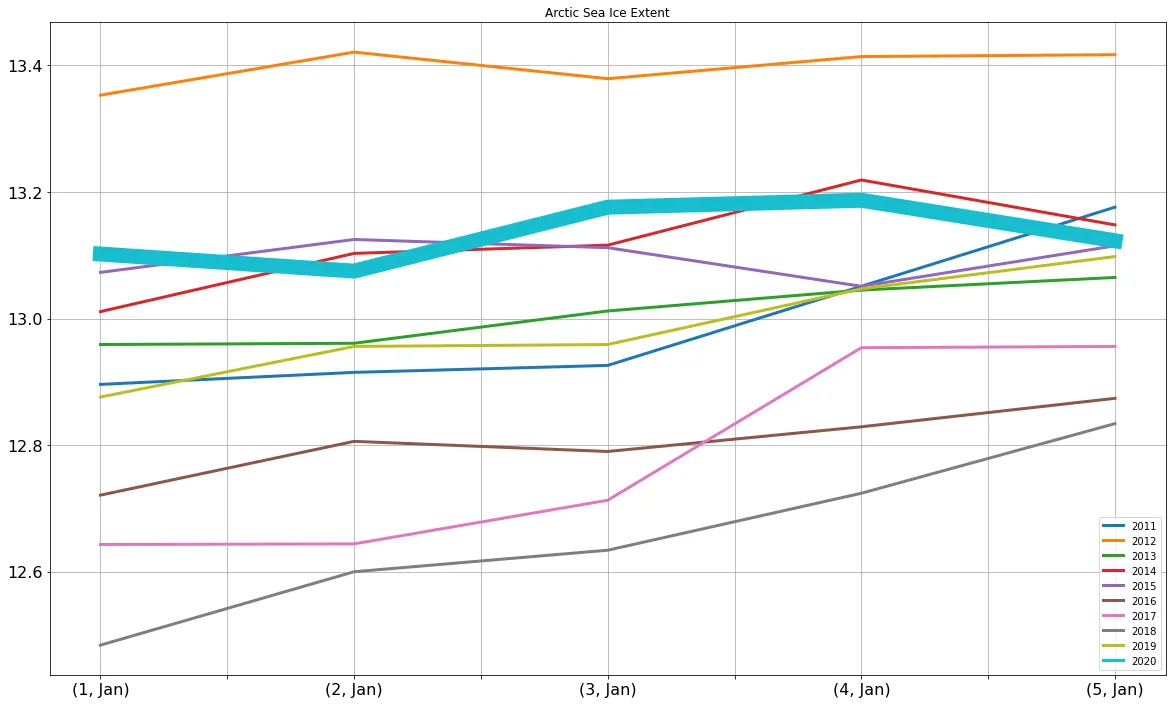
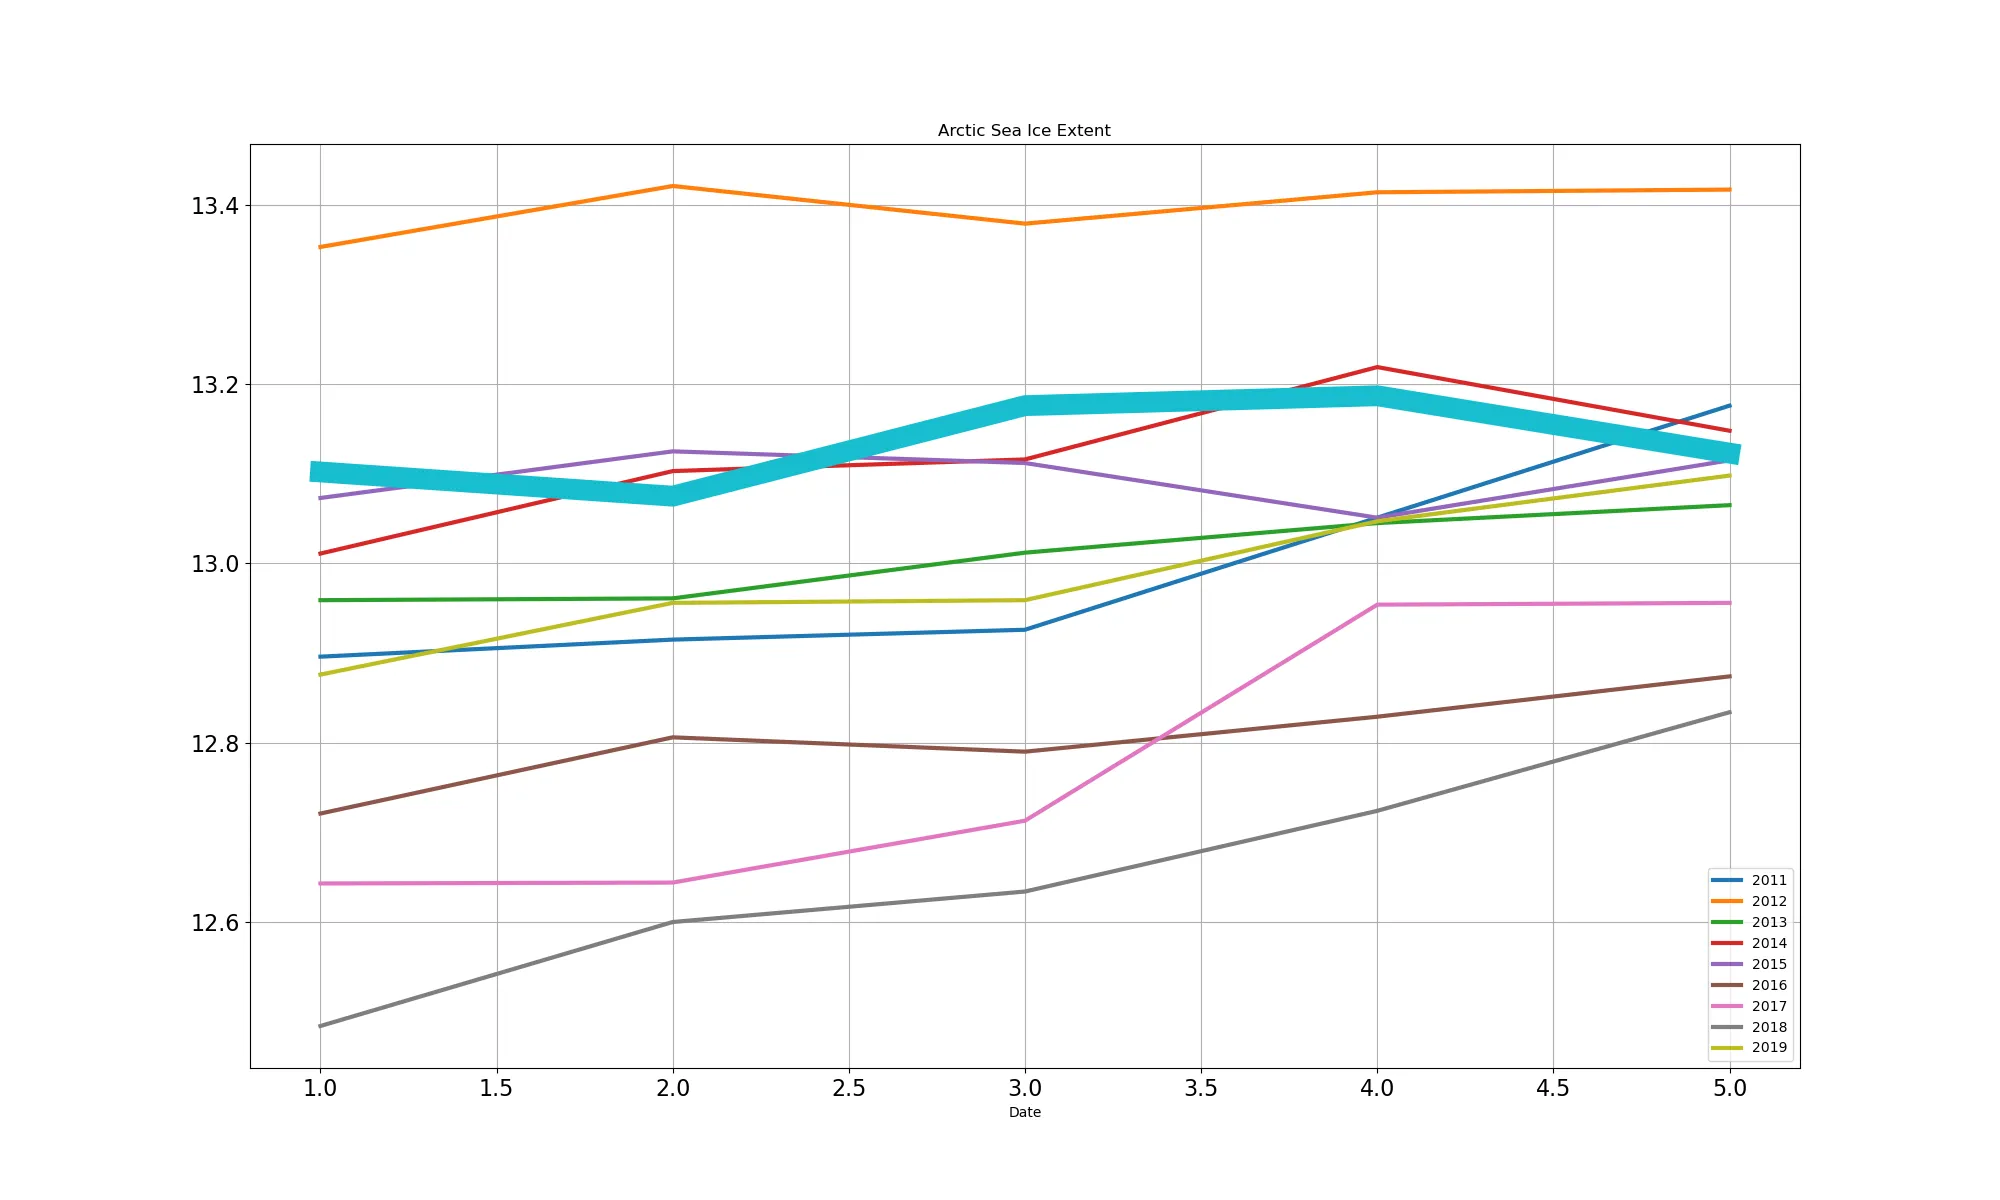
Date    2011    2012    2013    2014    2015    2016    2017    2018    2019    2020
Date                                        
01 Jan  12.896  13.353  12.959  13.011  13.073  12.721  12.643  12.484  12.876  13.102
02 Jan  12.915  13.421  12.961  13.103  13.125  12.806  12.644  12.600  12.956  13.075
03 Jan  12.926  13.379  13.012  13.116  13.112  12.790  12.713  12.634  12.959  13.176
04 Jan  13.051  13.414  13.045  13.219  13.051  12.829  12.954  12.724  13.047  13.187
05 Jan  13.176  13.417  13.065  13.148  13.115  12.874  12.956  12.834  13.098  13.123

绘图代码在这里。

ice_data_dates.plot(figsize=(20,12), title='Arctic Sea Ice Extent', lw=3, fontsize=16, ax=ax, grid=True)

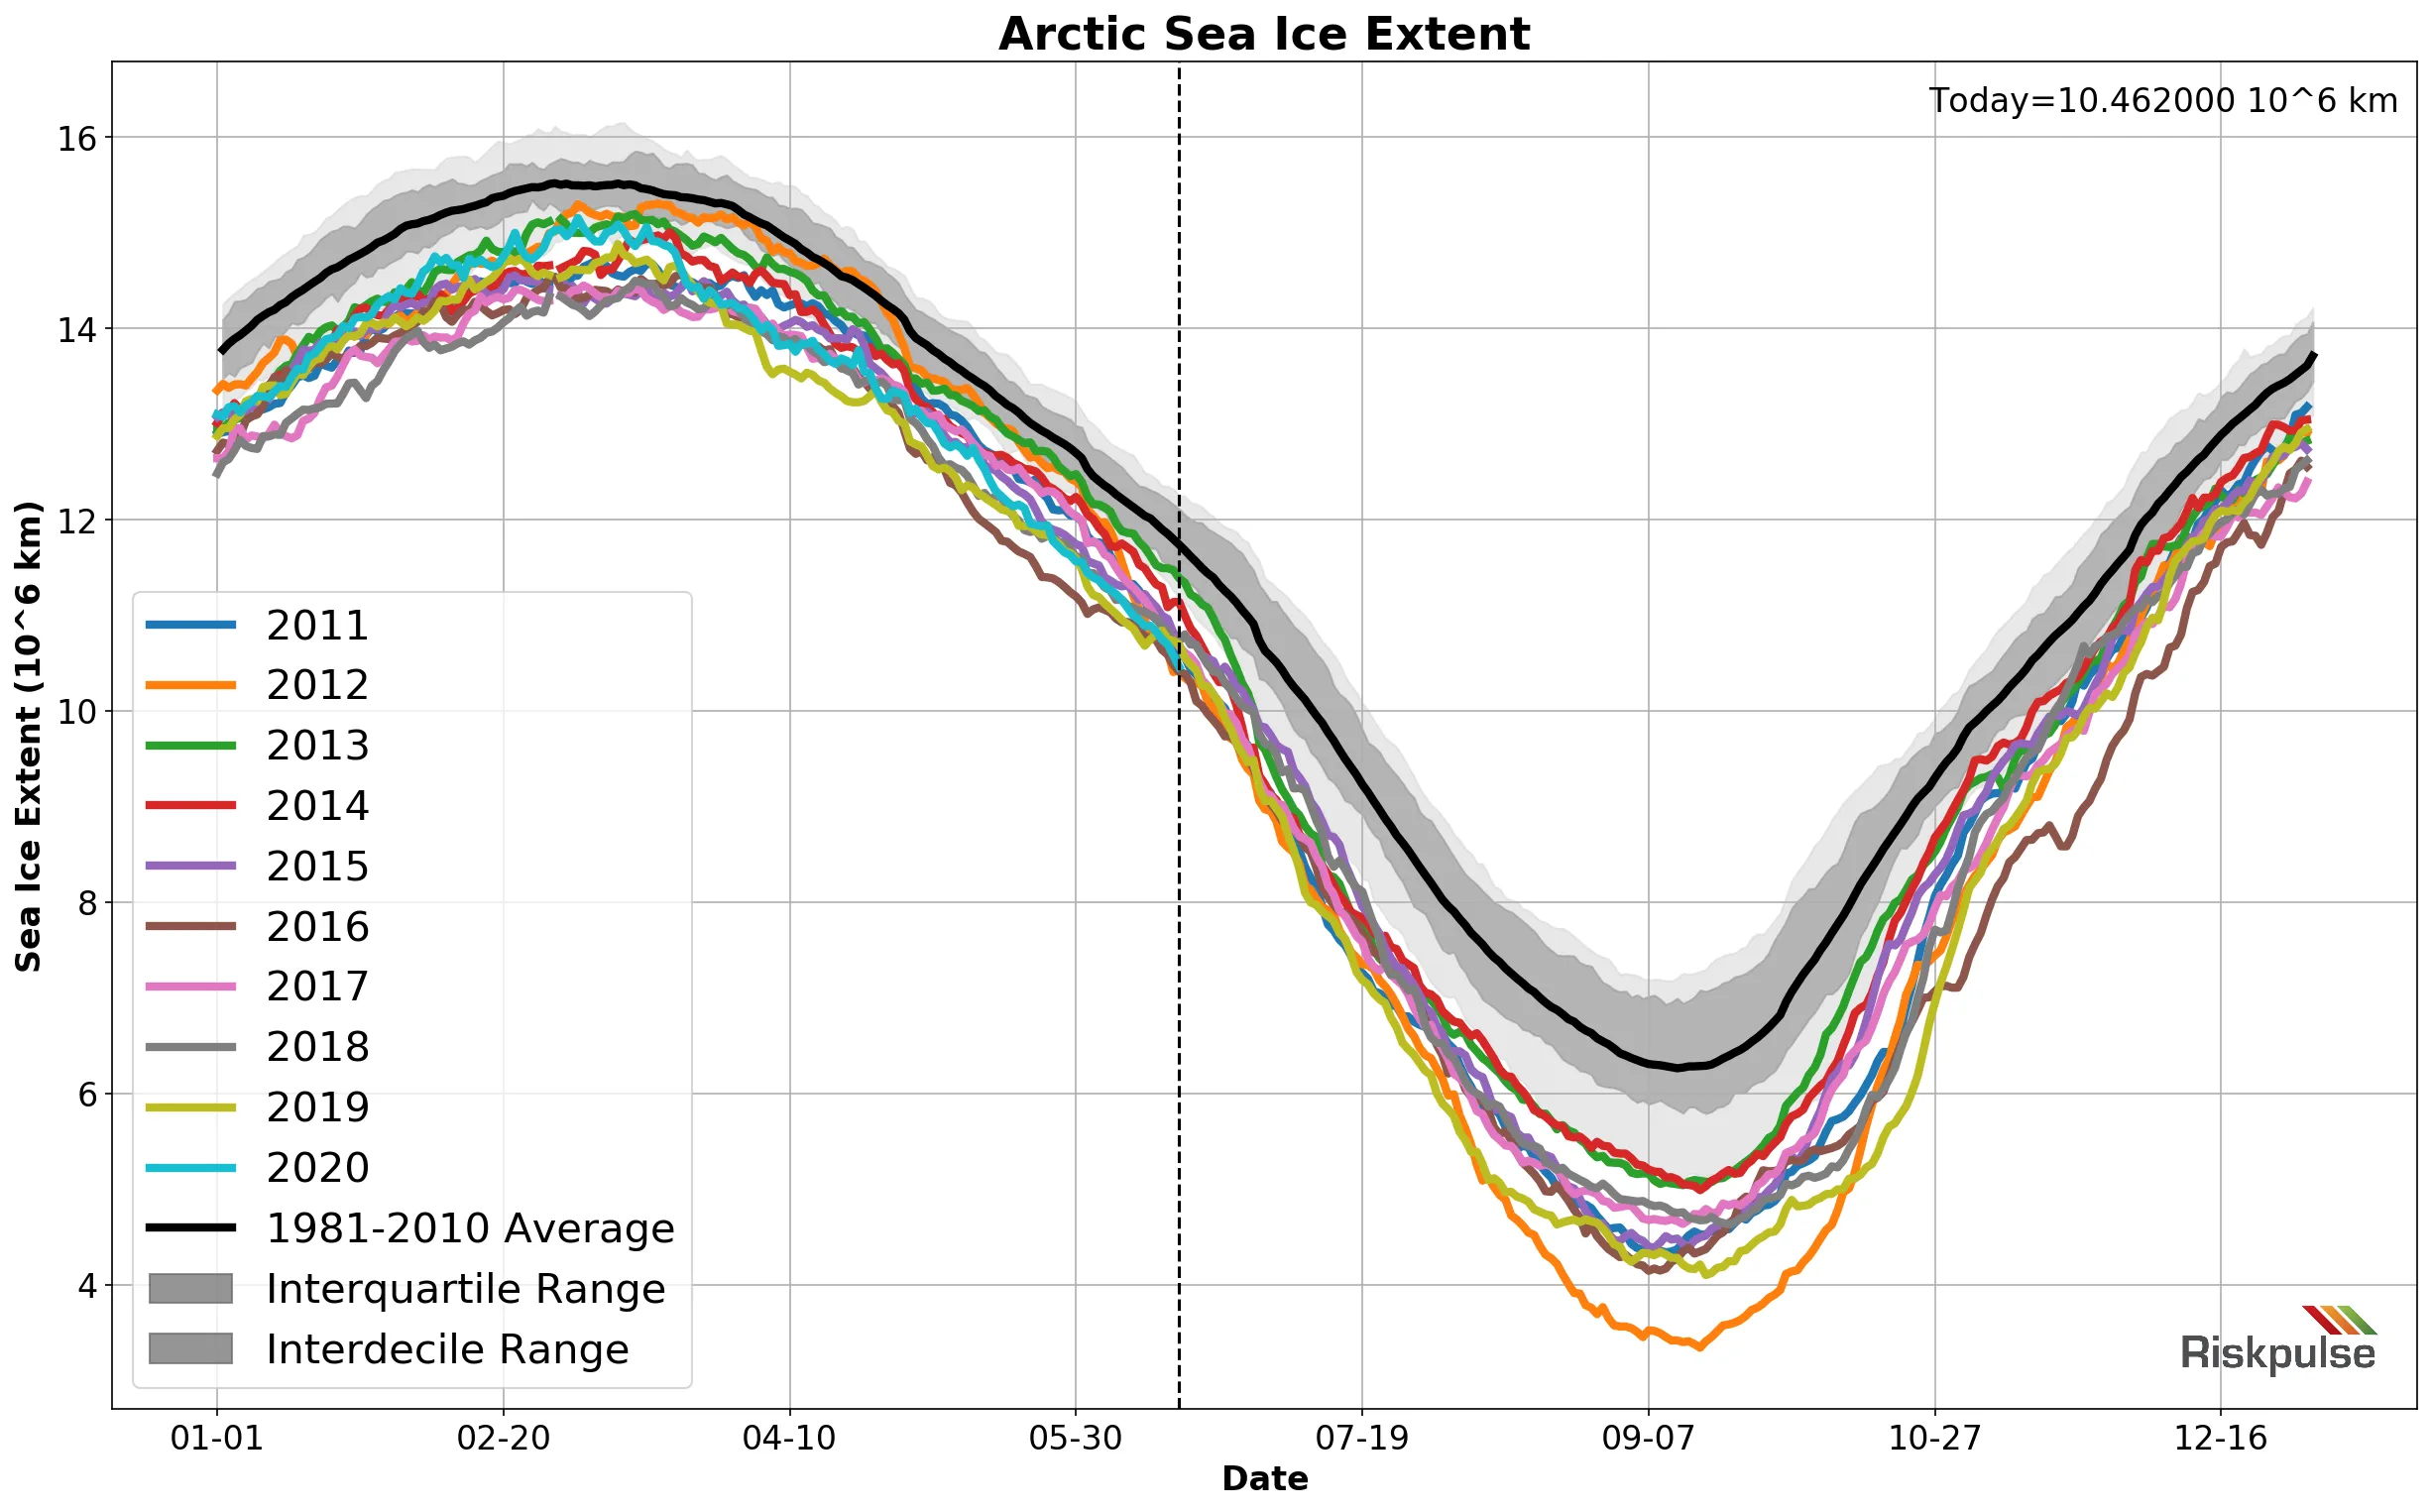
这将在数据帧中列出的每年的每天绘制一条线。然而,我希望使2020年的线条比其他年份更粗,以便更清晰地突出显示。是否可以使用这一行代码来实现?还是我需要手动绘制所有年份,以便可以分别控制每条线的粗细?当前附有一张图片,其中线条粗细均相同。

enter image description here

2个回答

19

您可以迭代绘图中的行,可以使用ax.get_lines检索到这些行,并在其与需要的值匹配时使用set_linewidth增加其宽度:

fig, ax = plt.subplots()
df.plot(figsize=(20,12), title='Arctic Sea Ice Extent', 
        lw=3, fontsize=16, ax=ax, grid=True)

for line in ax.get_lines():
    if line.get_label() == '2020':
        line.set_linewidth(15)
plt.show()

在此输入图片描述


你能否在图例中也增加线宽? - statHacker

5
您可以像这样用两行代码实现它:
ice_data_dates.loc[:, ice_data_dates.columns != "2020"].plot(figsize=(20, 12), title='Arctic Sea Ice Extent', lw=3, fontsize=16, ax=ax, grid=True)
ice_data_dates["2020"].plot(figsize=(20, 12), title='Arctic Sea Ice Extent', lw=15, fontsize=16, ax=ax, grid=True)

首先会绘制除2020列之外的整个数据框,然后只绘制2020列。输出如下图所示:

wider_line

这种方法与所选答案使用的方法不同,但得到的结果相同。


网页内容由stack overflow 提供, 点击上面的
可以查看英文原文,
原文链接