Matplotlib如何使用列表更改线段的线宽

6
我希望能根据一个数值列表来改变线条的宽度。例如,如果我要绘制以下列表:
a = [0.0, 1.0, 2.0, 3.0, 4.0]
是否可以使用以下列表来设置线条宽度?
b = [1.0, 1.5, 3.0, 2.0, 1.0]
似乎不被支持,但是他们说“一切皆有可能”,所以我想询问经验更丰富的人(我是新手)。
谢谢!
你能贴出你的代码吗?如果你正在绘制线条,你可以循环遍历每一条线,并为每一条线设置线宽。 - Garth5689
1个回答

14

基本上,你有两个选择。

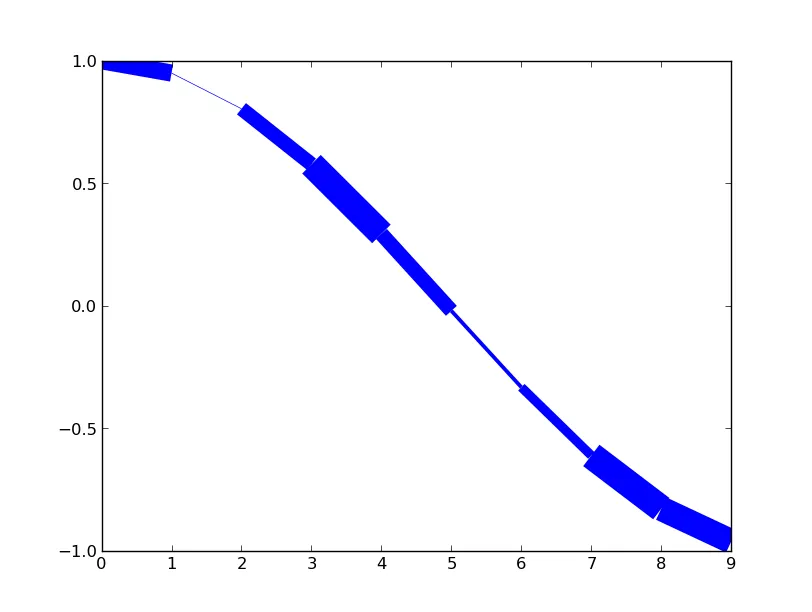
  1. 使用 LineCollection。在这种情况下,你的线宽将以点为单位,并且每个线段的线宽将保持不变。
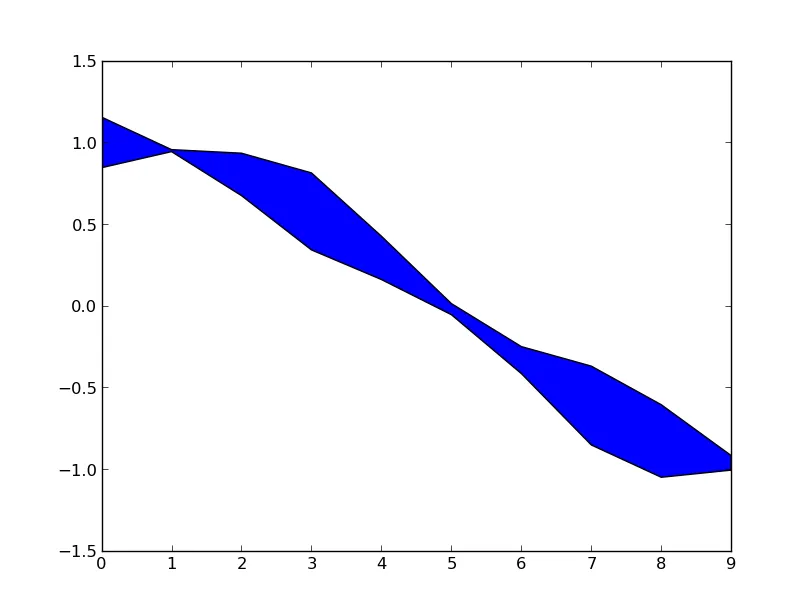
  2. 使用多边形(最容易使用 fill_between,但对于复杂曲线可能需要直接创建)。在这种情况下,你的线宽将以数据单位为准,并且会在线段之间线性变化。

以下是两种方法的示例:

Line Collection 示例


import numpy as np
import matplotlib.pyplot as plt
from matplotlib.collections import LineCollection
np.random.seed(1977)

x = np.arange(10)
y = np.cos(x / np.pi)
width = 20 * np.random.random(x.shape)

# Create the line collection. Widths are in _points_!  A line collection
# consists of a series of segments, so we need to reformat the data slightly.
coords = zip(x, y)
lines = [(start, end) for start, end in zip(coords[:-1], coords[1:])]
lines = LineCollection(lines, linewidths=width)

fig, ax = plt.subplots()
ax.add_collection(lines)
ax.autoscale()
plt.show()

在此输入图片描述

多边形示例:


import numpy as np
import matplotlib.pyplot as plt
np.random.seed(1977)

x = np.arange(10)
y = np.cos(x / np.pi)
width = 0.5 * np.random.random(x.shape)

fig, ax = plt.subplots()
ax.fill_between(x, y - width/2, y + width/2)
plt.show()

在此输入图片描述


fill_between()fill_betweenx()函数似乎适合我的需求。更详细的解释和示例可以在这里找到: https://jakevdp.github.io/PythonDataScienceHandbook/04.03-errorbars.html谢谢。 - Ido_f

网页内容由stack overflow 提供, 点击上面的
可以查看英文原文,
原文链接