基于坐标轴而非点的Matplotlib线宽

8
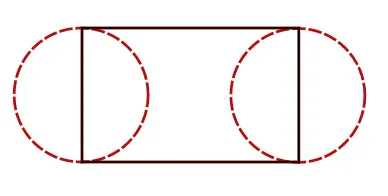
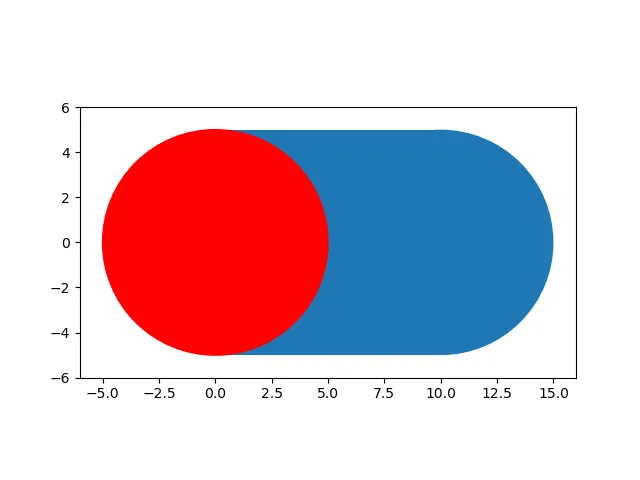
如果在Matplotlib中设置线宽,必须以点为单位给出线宽。在我的情况下,我有两个半径为R的圆,我想用一条直线连接它们。我想让这条线宽度为2 * R,以获得杆形状。但是,当我说myLines[i].set_linewidth(2*R)时,这使得线始终具有特定的厚度,而不管我缩放了多少。是否有一种方法可以使线的特定厚度不基于像素或点数,而是随着轴的缩放而变化?如何使我的线与我的圆的直径具有相同的宽度?我希望我已经解释清楚了,期待您的回答。

可能是matplotlib - 如何在数据单位中扩展指定宽度的线?的重复问题。 - ImportanceOfBeingErnest
2个回答

7

数据单位中的线

如果要以数据单位绘制带有线宽的线条,可以参考这个答案

它使用了一个名为data_linewidth_plot的类,其与plt.plot()命令的参数非常相似。

l = data_linewidth_plot( x, y, ax=ax, label='some line', linewidth = 1, alpha = 0.4)

linewidth参数是以(y-)数据单位解释的。

使用此解决方案,甚至不需要绘制圆形,因为可以简单地使用solid_capstyle="round"参数。

R=0.5
l = data_linewidth_plot( [0,3], [0.7,1.4], ax=ax, solid_capstyle="round", 
                        linewidth = 2*R, alpha = 0.4)

这里输入图片描述

棒形状

使用一个矩形和两个圆更容易制作出一根棒。 这里输入图片描述


6

正如你已经了解的那样,linewidths是在轴空间而不是数据空间中指定的。要在数据空间中绘制一条线,请绘制一个矩形:

import numpy as np
import matplotlib.pyplot as plt
from matplotlib.patches import Rectangle, Circle

r = 5 # rod radius
x1, y1 = (0,0) # left end of rod
x2, y2 = (10,0) # right end of rod

# create 2 circles and a joining rectangle
c1 = Circle((x1, y1), r, color='r')
c2 = Circle((x2, y2), r)
rect = Rectangle((x1, y1-r), width=x2-x1, height=2*r)

# plot artists
fig, ax = plt.subplots(1,1)
for artist in [c2, rect, c1]:
    ax.add_artist(artist)

# need to set axis limits manually
ax.set_xlim(x1-r-1, x2+r+1)
ax.set_ylim(y1-r-1, y2+r+1)

# set aspect so circle don't become oval
ax.set_aspect('equal')

plt.show()

enter image description here


网页内容由stack overflow 提供, 点击上面的
可以查看英文原文,
原文链接