以下代码是使用matplotlib绘制数据坐标为线宽的折线图的通用示例。有两种解决方案:一种使用回调,一种使用子类Line2D。
使用回调函数。
这个功能是以类data_linewidth_plot的形式实现的,可以使用与普通plt.plot命令非常接近的签名进行调用。
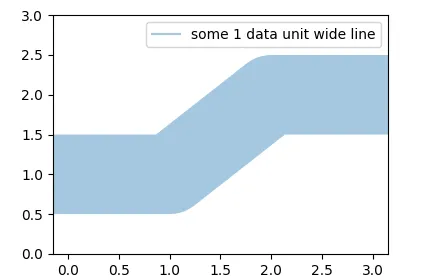
l = data_linewidth_plot(x, y, ax=ax, label='some line', linewidth=1, alpha=0.4)
ax参数是要绘图的轴。当图中仅存在一个子图时,可以省略ax参数。linewidth参数的解释以(y轴)数据单位为准。
进一步的功能:
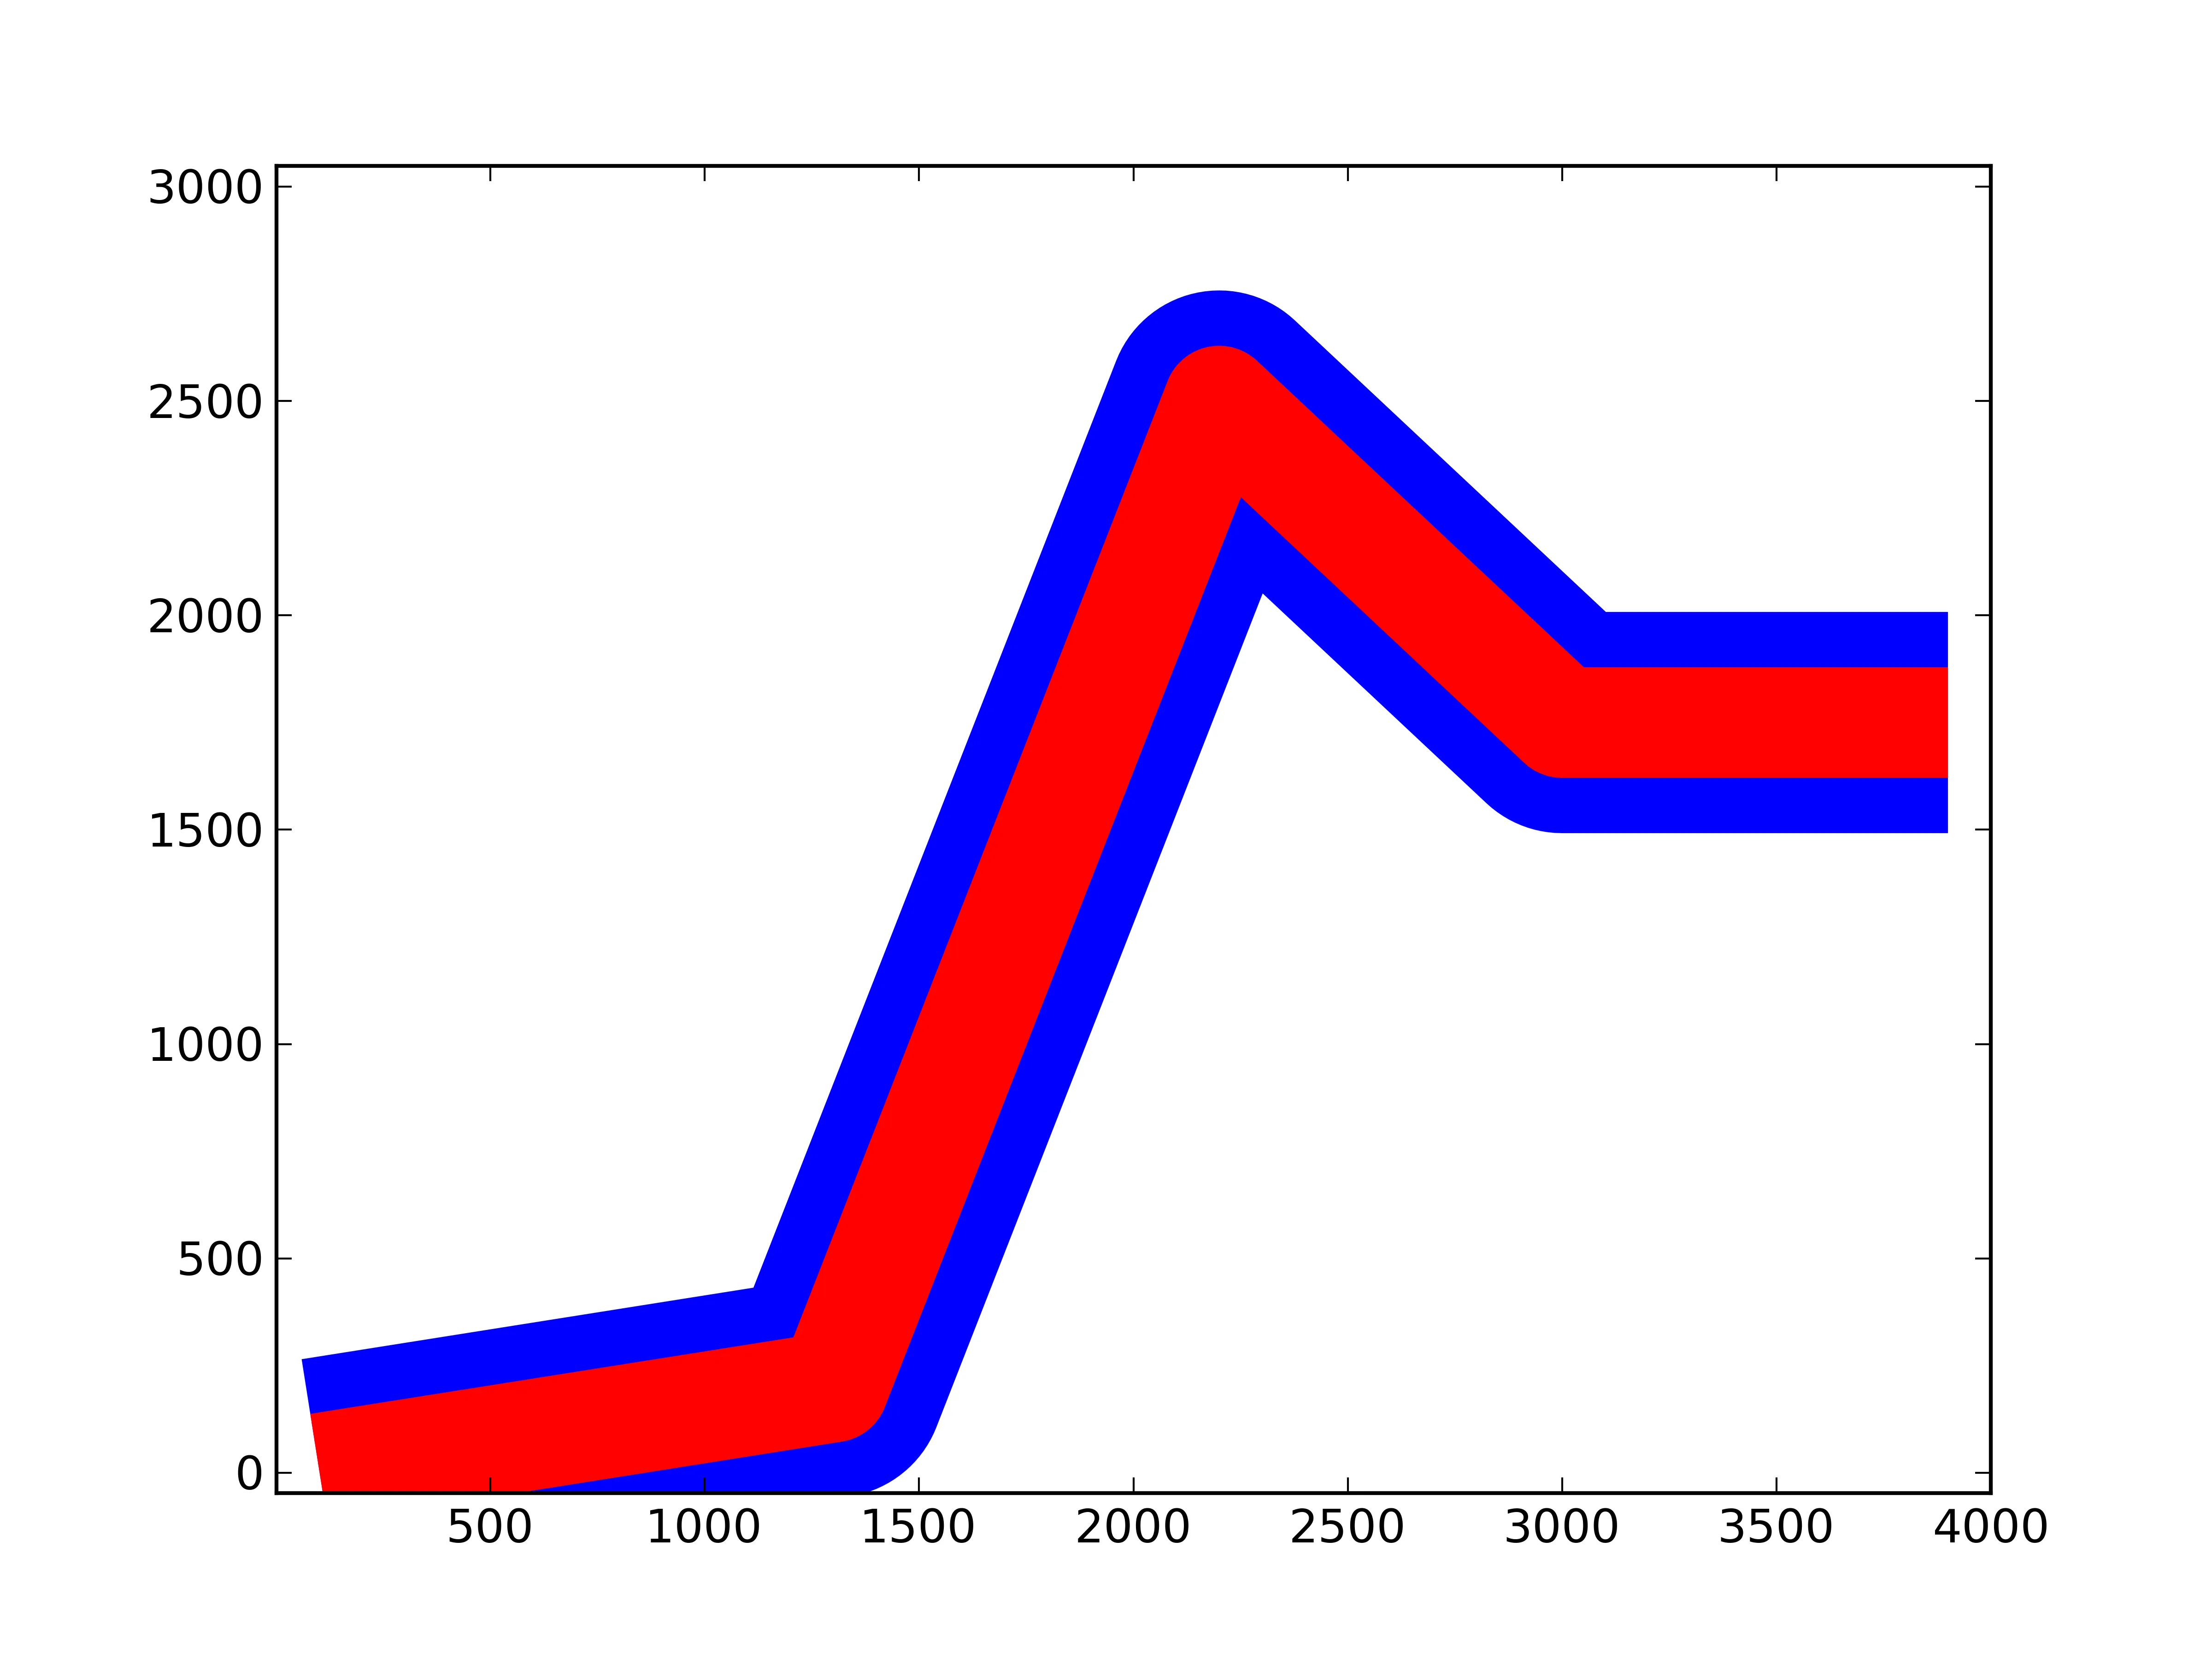
- 不受子图位置、边距或图形大小的影响。
- 如果纵横比例不相等,则使用y轴数据坐标作为线宽。
- 还确保图例处理正确(我们可能希望在图中有一条巨大的线,但在图例中绝对不会)。
- 与图形大小、缩放或平移事件的更改兼容,因为它会在此类事件上调整线宽。
这是完整的代码。
import matplotlib.pyplot as plt
class data_linewidth_plot():
def __init__(self, x, y, **kwargs):
self.ax = kwargs.pop("ax", plt.gca())
self.fig = self.ax.get_figure()
self.lw_data = kwargs.pop("linewidth", 1)
self.lw = 1
self.fig.canvas.draw()
self.ppd = 72./self.fig.dpi
self.trans = self.ax.transData.transform
self.linehandle, = self.ax.plot([],[],**kwargs)
if "label" in kwargs: kwargs.pop("label")
self.line, = self.ax.plot(x, y, **kwargs)
self.line.set_color(self.linehandle.get_color())
self._resize()
self.cid = self.fig.canvas.mpl_connect('draw_event', self._resize)
def _resize(self, event=None):
lw = ((self.trans((1, self.lw_data))-self.trans((0, 0)))*self.ppd)[1]
if lw != self.lw:
self.line.set_linewidth(lw)
self.lw = lw
self._redraw_later()
def _redraw_later(self):
self.timer = self.fig.canvas.new_timer(interval=10)
self.timer.single_shot = True
self.timer.add_callback(lambda : self.fig.canvas.draw_idle())
self.timer.start()
fig1, ax1 = plt.subplots()
ax1.set_ylim(0,3)
x = [0,1,2,3]
y = [1,1,2,2]
l = data_linewidth_plot(x, y, ax=ax1, label='some 1 data unit wide line',
linewidth=1, alpha=0.4)
plt.legend()
plt.show()
(由于此问题),我更新了代码,使用定时器重新绘制画布。
Line2D子类化
上述解决方案有一些缺点。它需要一个定时器和回调来在更改轴限制或图形大小时更新自身。以下是一种没有这种需求的解决方案。它将使用动态属性从所需数据坐标中始终计算出线宽度的点数。比以上方法短得多。
这里的缺点是需要手动通过代理艺术家创建传说。
import matplotlib.pyplot as plt
from matplotlib.lines import Line2D
class LineDataUnits(Line2D):
def __init__(self, *args, **kwargs):
_lw_data = kwargs.pop("linewidth", 1)
super().__init__(*args, **kwargs)
self._lw_data = _lw_data
def _get_lw(self):
if self.axes is not None:
ppd = 72./self.axes.figure.dpi
trans = self.axes.transData.transform
return ((trans((1, self._lw_data))-trans((0, 0)))*ppd)[1]
else:
return 1
def _set_lw(self, lw):
self._lw_data = lw
_linewidth = property(_get_lw, _set_lw)
fig, ax = plt.subplots()
ax.set_xlim(0,3)
ax.set_ylim(0,3)
x = [0,1,2,3]
y = [1,1,2,2]
line = LineDataUnits(x, y, linewidth=1, alpha=0.4)
ax.add_line(line)
ax.legend([Line2D([],[], linewidth=3, alpha=0.4)],
['some 1 data unit wide line'])
plt.show()
plt.plot(x, y, linewidth=6.0)- beroe