Matplotlib只有4种线条样式吗?

20

我一直在寻找Matplotlib中的新线条样式,唯一可用的线条样式是["-", "--", "-.", ":",]。(选项['',' ','None']不计算在内,因为它们只是隐藏线条。)

在Matplotlib pyplot中真的只有4种线条样式吗?是否有扩展程序可以添加更多线条样式?是否有一种方法可以自定义线条样式?如何使用三个字符的线条样式:

  • '--。': 破折号、破折号、点
  • '-..': 破折号、点、点
  • '...': 点、点、点(空格)
  • 'xxx': x形状的连续线
  • '\/': 锯齿形,即'\/\/\/\/'
  • '::': 平行圆点,即:::::

这些只是扩展线条样式范围的一些想法。

2个回答

21
你可以使用 dashes 参数来设置自定义的虚线样式。
根据文档
设置虚线序列,即以点为单位的虚线和实线的序列。如果 seq 为空或者 seq = (None, None),则线条样式将设置为实线。
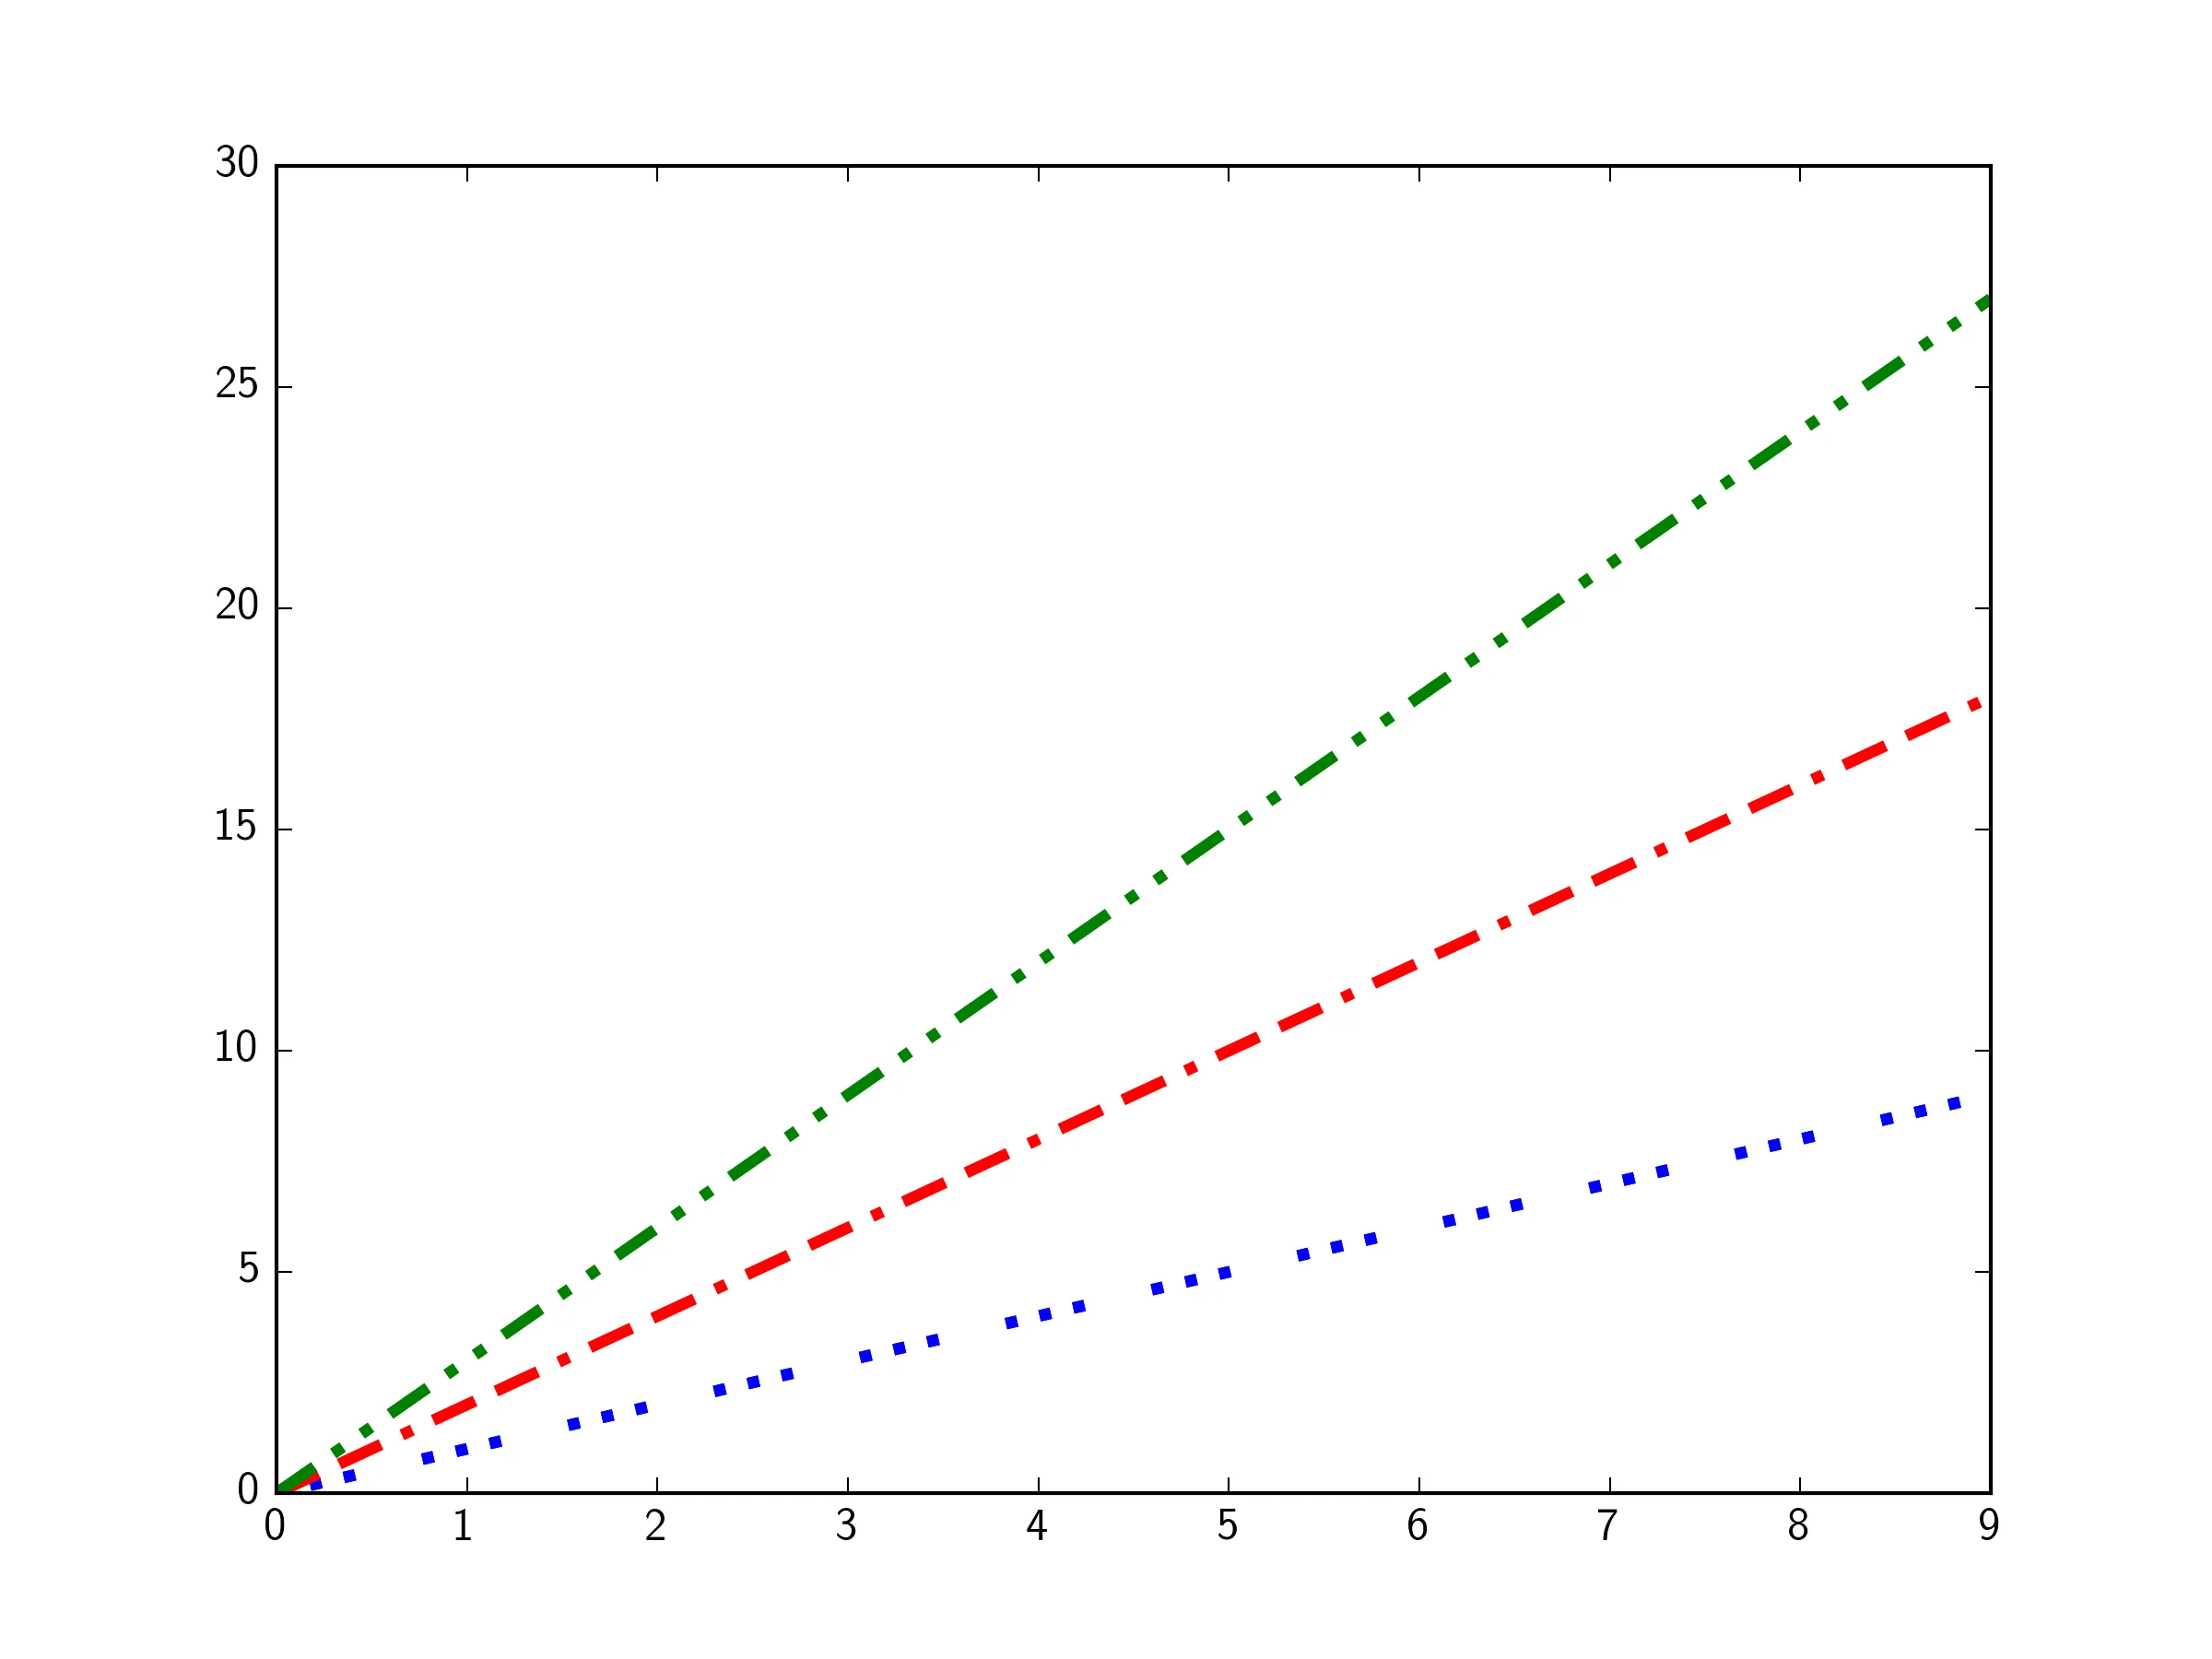
以下是基于你提供的几个建议的示例。显然还有很多其他方式可以进行自定义。
import matplotlib.pyplot as plt

fig,ax = plt.subplots(1)

# 3 dots then space
ax.plot(range(10), range(10),     dashes=[3,6,3,6,3,18],  lw=3,c='b')

# dash dash dot
ax.plot(range(10), range(0,20,2), dashes=[12,6,12,6,3,6], lw=3,c='r')

# dash dot dot
ax.plot(range(10), range(0,30,3), dashes=[12,6,3,6,3,6],  lw=3,c='g')

输入图像描述


4

我想增加一些来自2021年的附加信息。

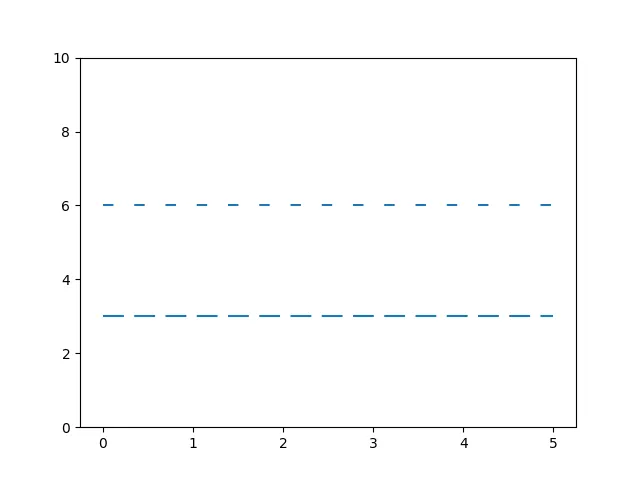
在matplotlib ver. 3.3.4中,虚线选项略有不同。您首先要循环使用虚线类型,然后再添加比率。

import matplotlib.pyplot as plt

plt.figure()

# dashed with dash length 10, space length 5
plt.hlines(3, 0, 5, linestyle="--", dashes=(0,(10,5)))

# dashed with dash length 5, space length 10
plt.hlines(6, 0, 5, linestyle="--", dashes=(0,(5,10)))

plt.ylim(0,10)
plt.show()


结果: 两条不同的虚线 更多信息请查看matplotlib文档

网页内容由stack overflow 提供, 点击上面的
可以查看英文原文,
原文链接