我正在绘制一些数据(两条线),我想改变线条的样式,使它们在差异显著的部分看起来不同。因此,在下面的图像中(现在是一个链接,因为反垃圾邮件政策不允许我发布图像),我希望线条在x轴约35处开始收敛之前的部分看起来不同(例如虚线)。
有没有一种简单的方法可以做到这一点?我已经有了差异显著性在x轴上的值,只是不清楚如何在特定的x轴位置更改线条样式。
我正在绘制一些数据(两条线),我想改变线条的样式,使它们在差异显著的部分看起来不同。因此,在下面的图像中(现在是一个链接,因为反垃圾邮件政策不允许我发布图像),我希望线条在x轴约35处开始收敛之前的部分看起来不同(例如虚线)。
有没有一种简单的方法可以做到这一点?我已经有了差异显著性在x轴上的值,只是不清楚如何在特定的x轴位置更改线条样式。
编辑:我已经打开并离开了,所以没有注意到@Ricardo的答案。因为matplotlib会将所有内容转换为numpy数组,所以有更有效的方法来完成此操作。
例如:
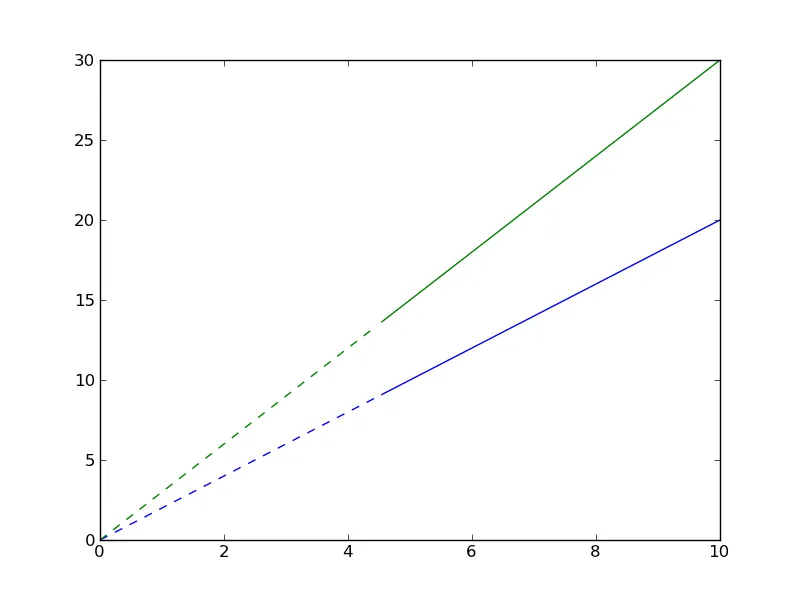
只需绘制两条不同的线,一条虚线样式,另一条实线样式。
例如:
import numpy as np
import matplotlib.pyplot as plt

x = np.linspace(0, 10, 100)
y1 = 2 * x
y2 = 3 * x

xthresh = 4.5
diff = np.abs(y1 - y2)
below = diff < xthresh
above = diff >= xthresh

# Plot lines below threshold as dotted...
plt.plot(x[below], y1[below], 'b--')
plt.plot(x[below], y2[below], 'g--')

# Plot lines above threshold as solid...
plt.plot(x[above], y1[above], 'b-')
plt.plot(x[above], y2[above], 'g-')

plt.show()
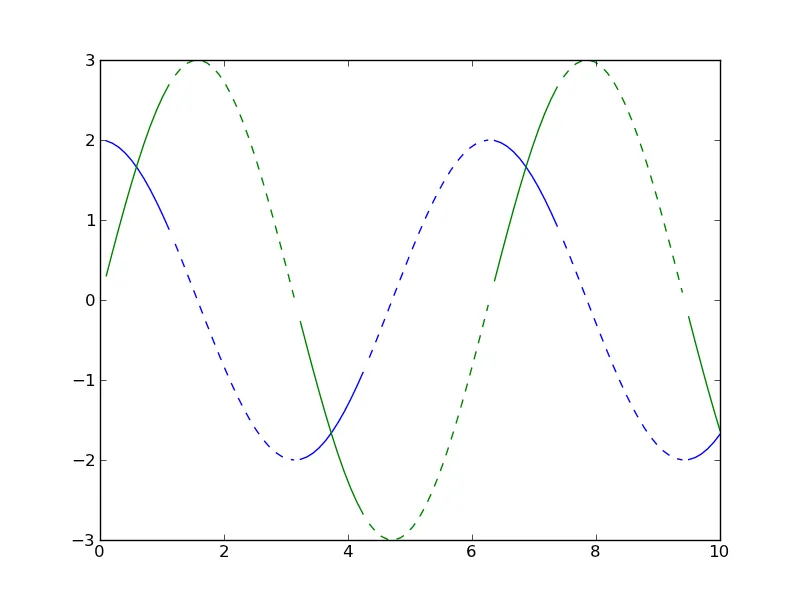
对于循环的情况,请使用屏蔽数组:
import numpy as np
import matplotlib.pyplot as plt

x = np.linspace(0, 10, 100)
y1 = 2 * np.cos(x)
y2 = 3 * np.sin(x)

xthresh = 2.0
diff = np.abs(y1 - y2)
below = diff < xthresh
above = diff >= xthresh

# Plot lines below threshold as dotted...
plt.plot(np.ma.masked_where(below, x), np.ma.masked_where(below, y1), 'b--')
plt.plot(np.ma.masked_where(below, x), np.ma.masked_where(below, y2), 'g--')

# Plot lines above threshold as solid...
plt.plot(np.ma.masked_where(above, x), np.ma.masked_where(above, y1), 'b-')
plt.plot(np.ma.masked_where(above, x), np.ma.masked_where(above, y2), 'g-')

plt.show()
plt.plot(x[below], y1[below], 'b--') 这行代码的作用吗? - Ohmbelow是一个布尔数组,例如 [True, True, False, False, True])仅选择 diff < xthresh 的区域在 x 和 y 中。例如,如果 x = np.arange(10),并且我们执行 print x[x < 5],我们会得到 [0, 1, 2, 3, 4]。但是,这假设我们有一条具有许多采样点的线。如果你有 x = array([0, 1]) 并且你做了 x[x < 0.5],你只会得到 0,而不是 [0, 0.499999]。它只选择满足给定条件的离散点,而不是插值。 - Joe Kingtondef group(data):
"""Assumes that len(data) > 0"""
prev = 0
index = 1
value = data[0]
while (index < len(data)):
if data[index] != value:
yield (value, prev, index)
value = not value
prev = index
index += 1
yield (value, prev, index)
diff = np.abs(dataset1 - dataset2)
for significant, start, end in group(diff < threshold):
# Plot data from dataset1[start:end] and dataset2[start:end]
# Use the value in "significant" (True/False) to figure out
# The style
itertools中的某些东西可以更简短地完成,但我想这已经足够好了:P - Ricardo Cárdenes