我正在绘制数据矩阵的轮廓图。该矩阵的一些元素是NaN(对应于不存在解的参数组合)。我想通过阴影区域在轮廓图中指示此区域。有什么方法可以实现?
在matplotlib中的轮廓图中孵化一个NaN区域
3
- Mathias Vanwolleghem
1
可能是Matplotlib imshow中的选择性模式的重复问题。 - tacaswell
1个回答
11
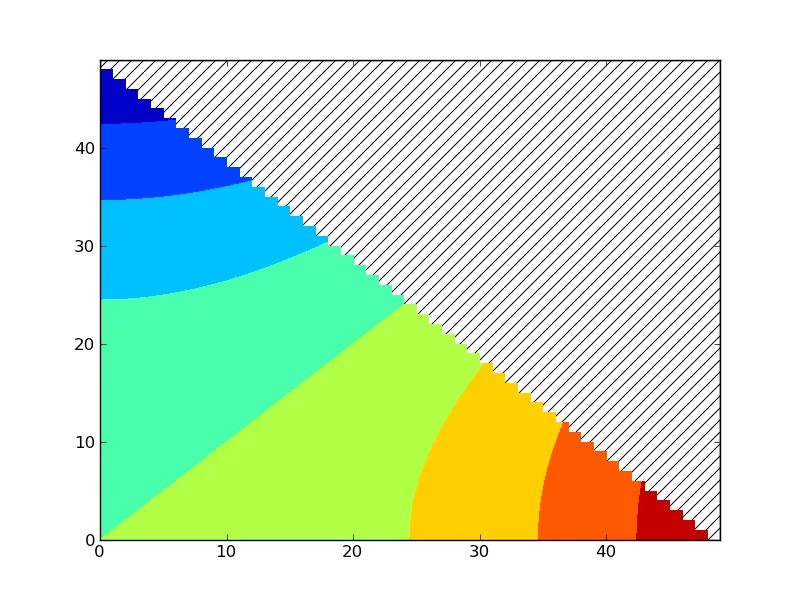
contourf和contour方法在数组被掩码时不会绘制任何内容(参见此处)!因此,如果您想要绘图的NaN元素区域呈现出斜线阴影,则只需将绘图的背景定义为斜线阴影即可。
请参考以下示例:
import matplotlib.pyplot as plt
import matplotlib.patches as patches
import numpy as np

fig = plt.figure()
ax = fig.add_subplot(111)

# generate some data:
x,y = np.meshgrid(np.linspace(0,1),np.linspace(0,1))
z = np.ma.masked_array(x**2-y**2,mask=y>-x+1)

# plot your masked array
ax.contourf(z)

# get data you will need to create a "background patch" to your plot
xmin, xmax = ax.get_xlim()
ymin, ymax = ax.get_ylim()
xy = (xmin,ymin)
width = xmax - xmin
height = ymax - ymin

# create the patch and place it in the back of countourf (zorder!)
p = patches.Rectangle(xy, width, height, hatch='/', fill=None, zorder=-10)
ax.add_patch(p)
plt.show()
您将得到这个图形:
- carla
网页内容由stack overflow 提供, 点击上面的可以查看英文原文,
原文链接
原文链接