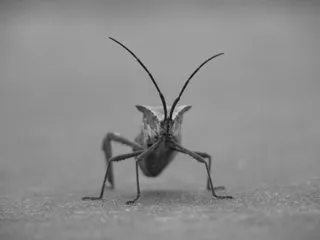
在 matplotlib 图中插入一个 png 图像。

7

我正在尝试在matplotlib图中插入一个PNG图像(ref

import matplotlib.pyplot as plt
import numpy as np

from matplotlib.figure import Figure
from matplotlib.offsetbox import OffsetImage, AnnotationBbox


ax = plt.subplot(111)
ax.plot(
    [1, 2, 3], [1, 2, 3],
    'go-',
    label='line 1',
    linewidth=2
 )
arr_img = plt.imread("stinkbug.png")
im = OffsetImage(arr_img)
ab = AnnotationBbox(im, (1, 0), xycoords='axes fraction')
ax.add_artist(ab)
plt.show()

插入图片:

enter image description here

获得的输出:

enter image description here

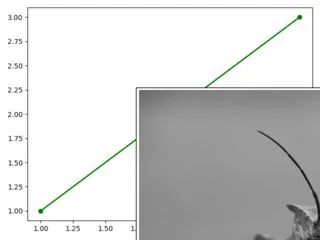
我想知道如何调整要插入的图像大小以避免重叠。

编辑: 保存图片。

ax.figure.savefig("output.svg", transparent=True, dpi=600, bbox_inches="tight")

enter image description here

1个回答

8
你可以对图像进行缩放,并将框对齐到右下角(0,1),加上一些额外的空白边距:
im = OffsetImage(arr_img, zoom=.45)
ab = AnnotationBbox(im, (1, 0), xycoords='axes fraction', box_alignment=(1.1,-0.1))

enter image description here

您可能还希望使用数据坐标,这是默认设置,并使用默认的盒子对齐方式居中,例如 ab = AnnotationBbox(im, (2.6, 1.45))。有关各种坐标选项的更多信息,请参见xycoords参数文档

嗨@Stef,当我尝试保存这个文件
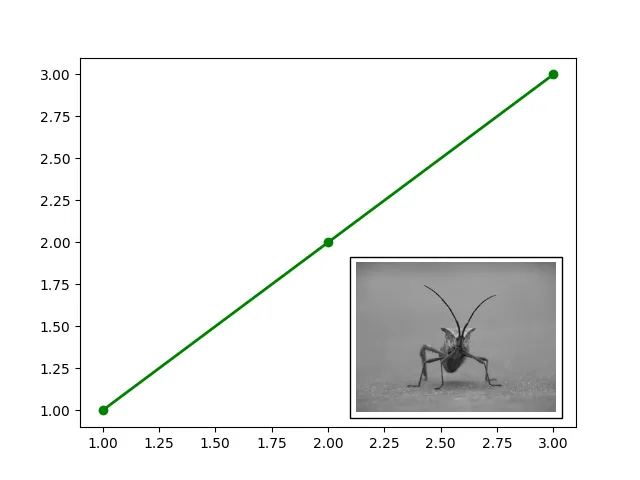
fig.savefig("output.svg", transparent=True, dpi=600, bbox_inches="tight")时,不幸的是我无法在输出图像中找到插图。 - Natasha
"savefig" 对我来说是正常工作的(matplotlib版本3.3.1)。你正在使用什么版本? - Stef
嗯,我只能说对我来说它完全没有问题,可以看 https://i.stack.imgur.com/OtUKI.png,使用你在评论或编辑中给出的命令。 - Stef
抱歉,上次我忘了提到版本号。我正在使用的是matplotlib 3.3.3。 - Natasha
这是我的output.svg文件,链接在之前的评论中展示过,你打开后看起来正确吗? - Stef
非常感谢您分享这张图片。当我在Pycharm窗口中下载并打开该图片时,我遇到了同样的问题。但是,当我在浏览器中打开它时,它可以正常工作,没有任何问题。 - Natasha

网页内容由stack overflow 提供, 点击上面的
可以查看英文原文,
原文链接