我希望在 matplotlib 的 stackplot 中生成区域标签。如果只能标记边界的线,也可以接受。考虑以下示例:
import numpy as np
from matplotlib import pyplot as plt
fnx = lambda : np.random.randint(5, 50, 10)
x = np.arange(10)
y1, y2, y3 = fnx(), fnx(), fnx()
areaLabels=['area1','area2','area3']
fig, ax = plt.subplots()
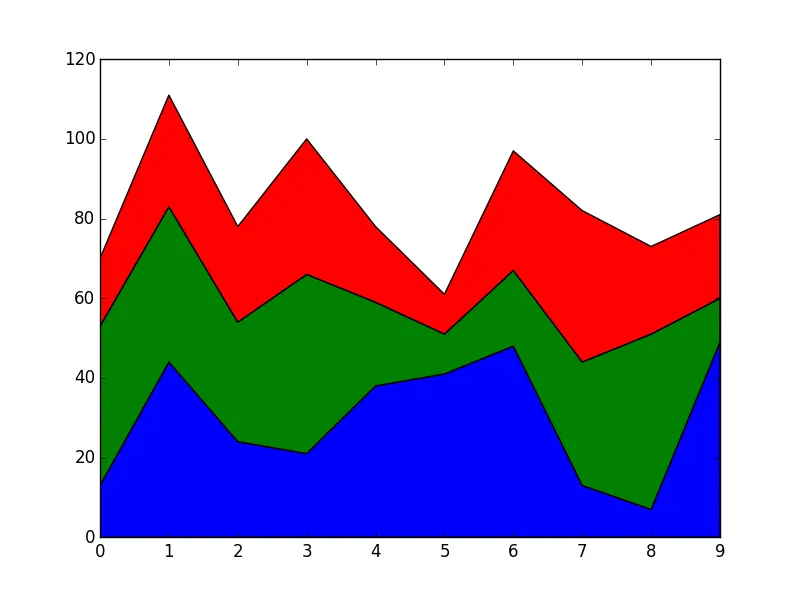
ax.stackplot(x, y1, y2, y3)
plt.show()
这将产生:
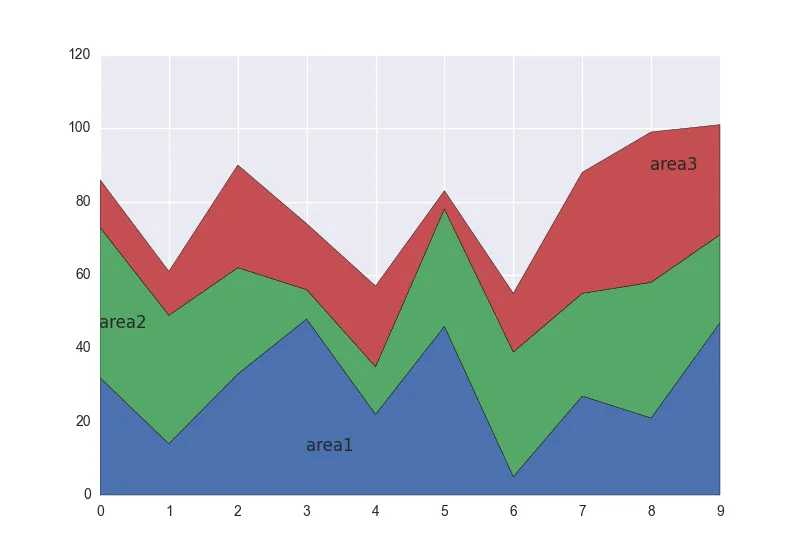
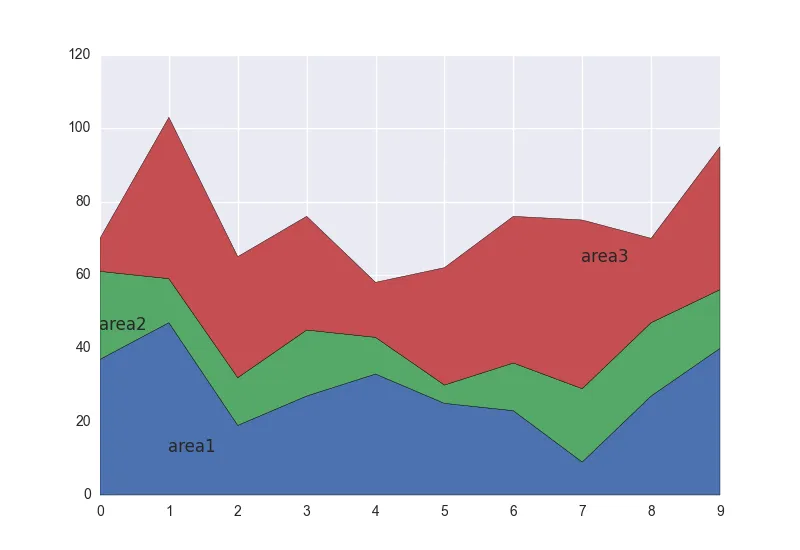
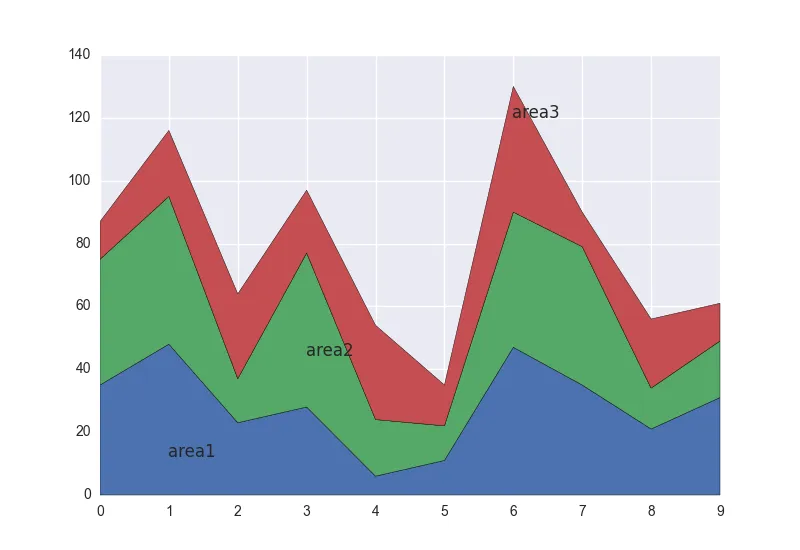
 但我想要的是这样的:
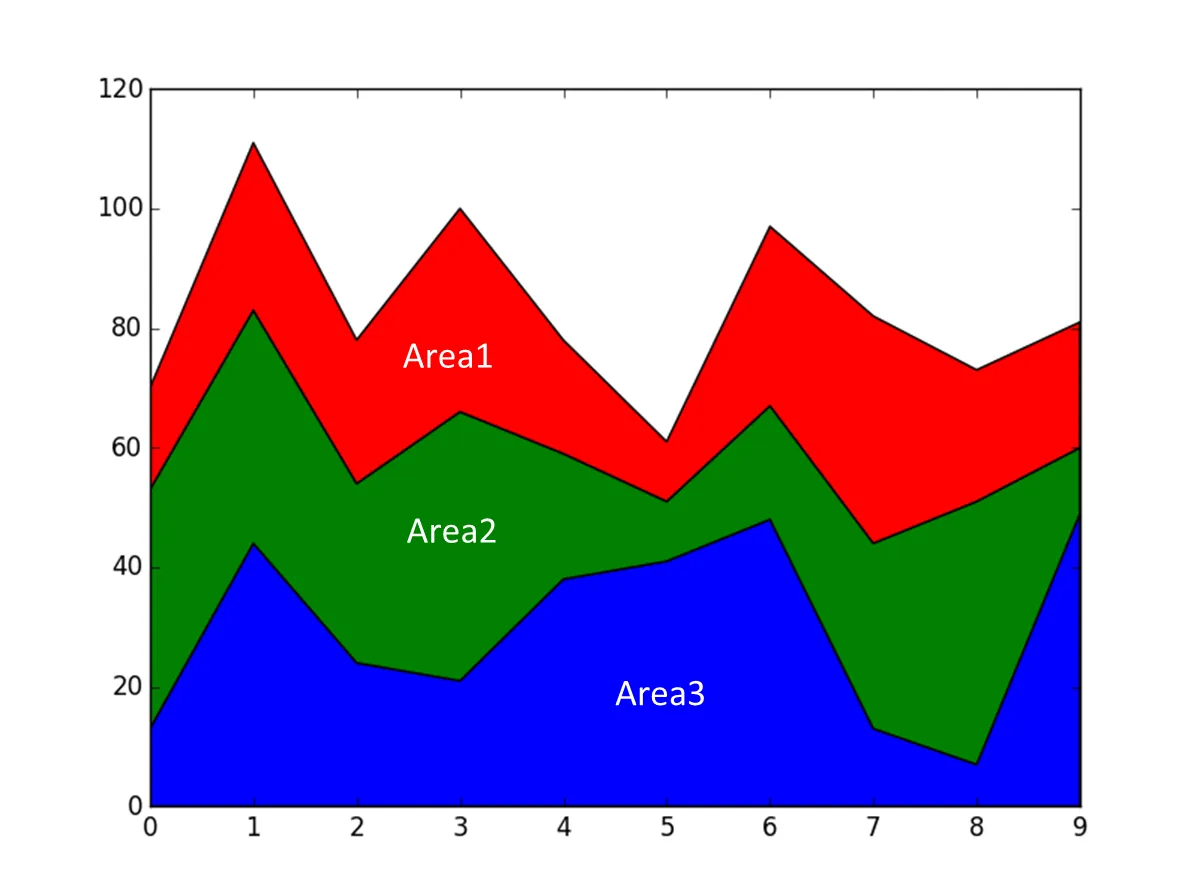 Matplotlib轮廓图具有此类型的标签功能(尽管在轮廓图的情况下,线条是带标签的)。
任何帮助(甚至是将我可能错过的帖子重定向)都将不胜感激。