如何使用双Y轴绘制这些数据?

3

我有数据:

structure(list(Group.1 = structure(c(17897, 17928, 17956, 17987, 
18017, 18048, 18078, 18109, 18140, 18170, 18201, 18231, 18262, 
18293, 18322, 18353, 18383, 18414, 18444, 18475, 18506, 18536, 
18567, 18597), class = "Date"), Total.y = c(431L, 399L, 424L, 
421L, 390L, 383L, 397L, 403L, 476L, 507L, 505L, 556L, 604L, 618L, 
39491L, 119263L, 111533L, 98341L, 77406L, 64553L, 116157L, 130517L, 
130685L, 149184L), t_VidP = c(92.3433874709977, 94.7368421052632, 
91.2735849056604, 94.061757719715, 96.6666666666667, 93.9947780678851, 
94.7103274559194, 95.0372208436725, 94.9579831932773, 91.3214990138067, 
93.8613861386139, 94.9640287769784, 93.5430463576159, 93.3656957928803, 
73.8699956952217, 79.24251444287, 81.4395739377583, 81.8275185324534, 
83.9921969873136, 85.6954750360169, 92.2596141429272, 93.4452983136296, 
93.5248880896813, 92.8739006864007)), row.names = c(NA, -24L), class = "data.frame")

看起来像这样:

Group.1             Total.y   t_VidP
    1 2019-01-01     431 92.34339
    2 2019-02-01     399 94.73684
    3 2019-03-01     424 91.27358
    4 2019-04-01     421 94.06176
    5 2019-05-01     390 96.66667
    6 2019-06-01     383 93.99478

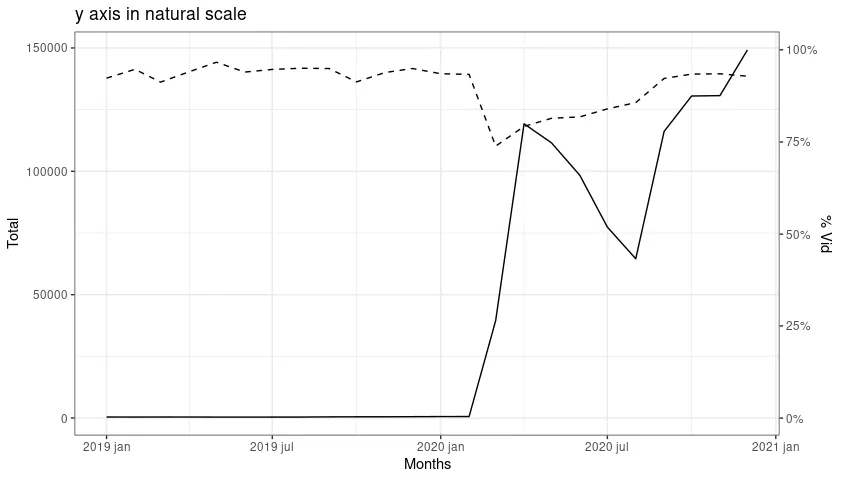
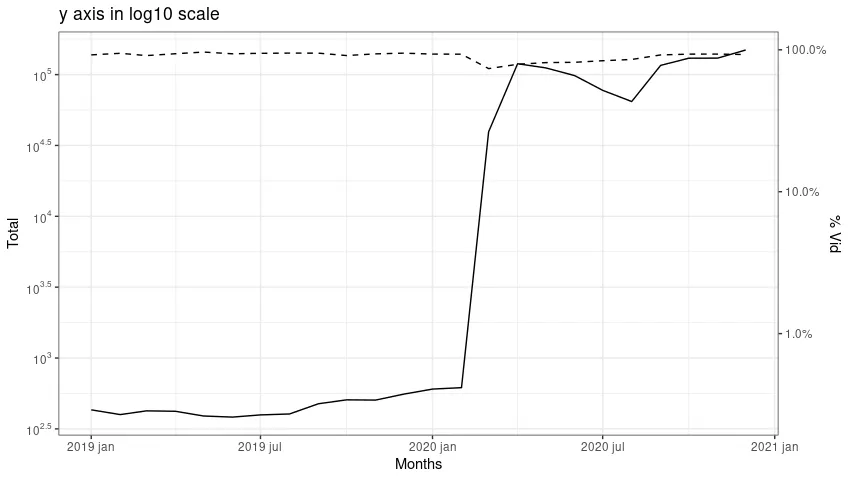
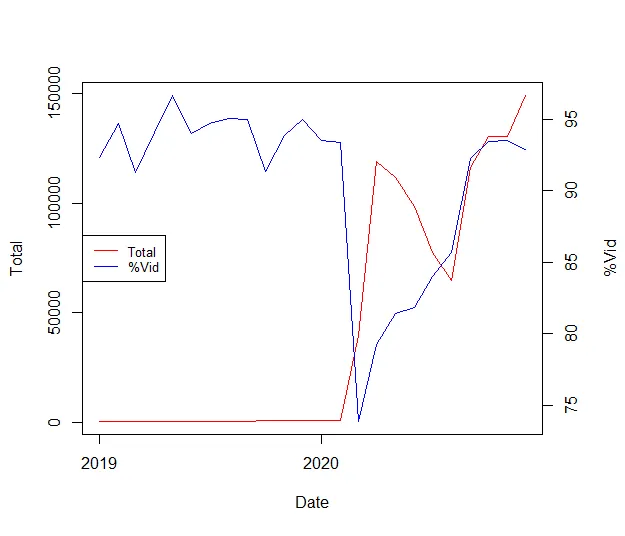
我需要一个图表,左y轴显示Total.y数据,右y轴显示t_VidP数据(刻度范围为0到100),x轴显示月份。我还需要x轴和y轴的标题。最好的效果是:https://imgur.com/a/VjuLm0O
3个回答

2
这里有两个带有第二y轴的图表,其中第二个图表的y轴使用了log10比例尺,因为Total.y范围很大。另外,请参见此SO帖子
至于第二个y轴,诀窍在于计算一个缩放因子M。由于百分比列的范围是0-100,因此将其除以100并使用scales::percent自动格式化百分比。
library(ggplot2)
library(scales)

M <- max(df1$Total.y)

ggplot(df1, aes(Group.1)) +
  geom_line(aes(y = Total.y)) +
  geom_line(aes(y = M * t_VidP/100), linetype = "dashed") +
  scale_x_date(date_labels = "%Y %b") +
  scale_y_continuous(
    sec.axis = sec_axis(~ . / M, name = "% Vid", labels = percent)
  ) +
  ggtitle("y axis in natural scale") +
  labs(x = "Months", y = "Total") +
  theme_bw()

enter image description here

ggplot(df1, aes(Group.1)) +
  geom_line(aes(y = Total.y)) +
  geom_line(aes(y = M * t_VidP/100), linetype = "dashed") +already 
  scale_x_date(date_labels = "%Y %b") +
  scale_y_continuous(
    trans = "log10",
    breaks = trans_breaks("log10", function(x) 10^x),
    labels = trans_format("log10", math_format(10^.x)),
    sec.axis = sec_axis(~ . / M, name = "% Vid", labels = percent)
  ) +
  ggtitle("y axis in log10 scale") +
  labs(x = "Months", y = "Total") +
  theme_bw()

enter image description here


2
此外,基于R语言的方法如下:
par(mar = c(5, 4, 4, 4) + 0.3)
plot(df$Group.1, df$Total.y, col = "red", type = "l", xlab = "Date", ylab = "Total")
par(new = T)
plot(df$Group.1, df$t_VidP, col = "blue", type = "l", xlab = "", ylab = "", axes = F)
axis(side = 4, at = pretty(range(df$t_VidP)))
mtext("%Vid", side = 4, line = 3)
legend(x = "left", legend=c("Total", "%Vid"),
       col=c("red", "blue"), lty=1, cex=0.8)

enter image description here


非常感谢!您能添加几个更多的x轴刻度和一个标题吗?如果我想要将右侧的y轴更改为0到100,我该怎么做? - Evan
@Evan,不客气。 :) 你可以使用
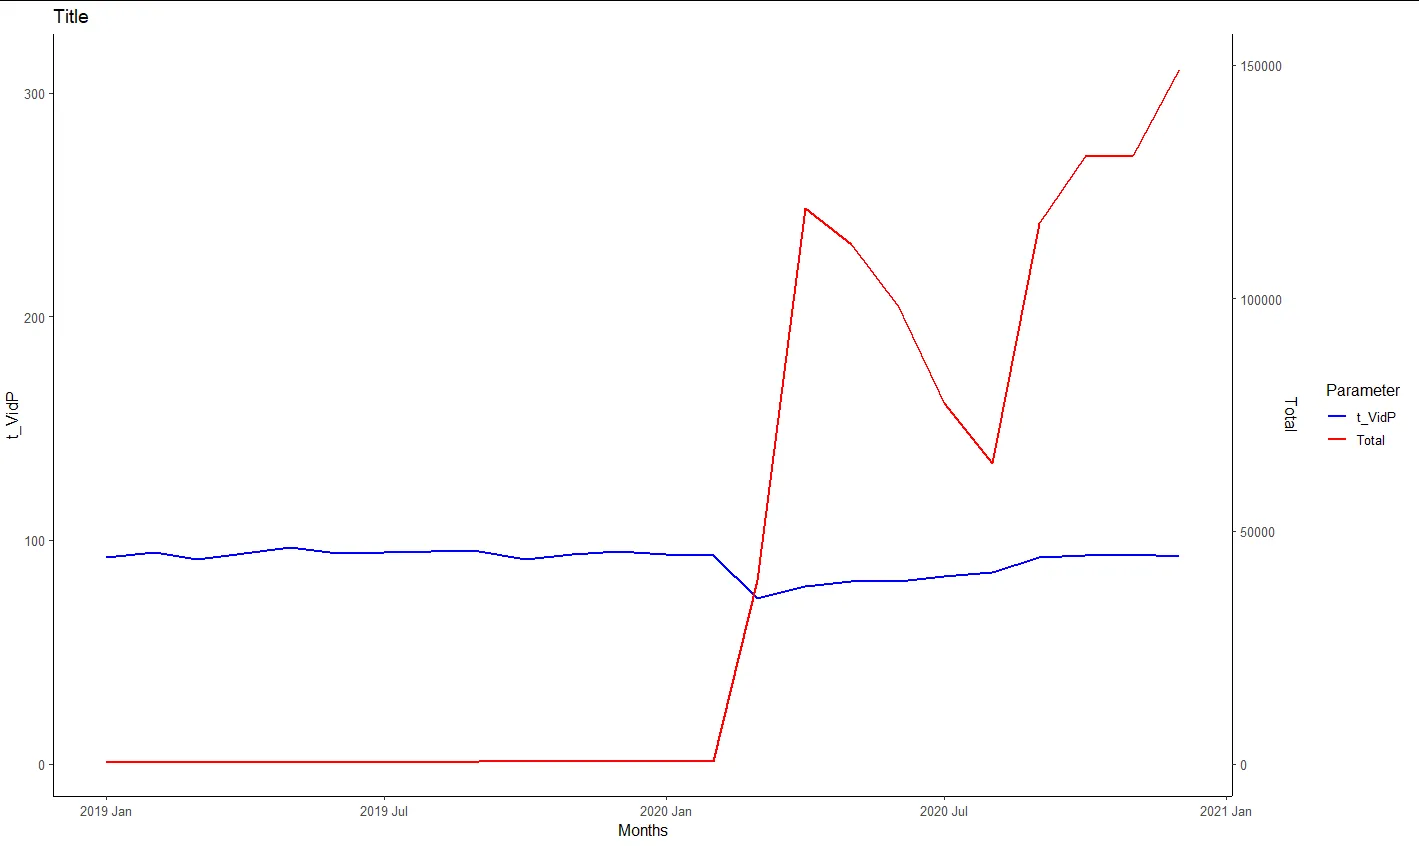
lubridate包中的函数随意操作x轴(日期变量)(例如,要仅保留月份,可以使用month()),这应该会改善x轴。例如,可以使用ylim = c(0, 100)来修改y轴限制。 - bird

1

我试图将AES保持在y之外。

library(tidyverse)
library(lubridate)
df %>% 
  mutate(Total.y_transformed = Total.y/(43485.2 /90.54 )) %>% 
  mutate(month = month(ymd(Group.1), label = TRUE)) %>% 
  pivot_longer(
    cols = c(Total.y_transformed, t_VidP),
    names_to = 'names',
    values_to = 'value'
  ) %>% 
  arrange(names)

ggplot(df1, aes(x = Group.1, y = value, color=names)) + 
  geom_line(size=1) +   
  scale_color_manual(labels = c("t_VidP", "Total"), values = c("blue", "red")) + 
  scale_y_continuous(sec.axis = sec_axis(~.*(43485.2 /90.54), name = "Total")) +
  scale_x_date(date_labels = "%Y %b") +
  ggtitle("Title") +
  labs(x = "Months", y = "t_VidP",  colour = "Parameter") +
  theme(legend.position = c(0.8, 0.9)) +
  theme_classic(base_size=12)

enter image description here


网页内容由stack overflow 提供, 点击上面的
可以查看英文原文,
原文链接