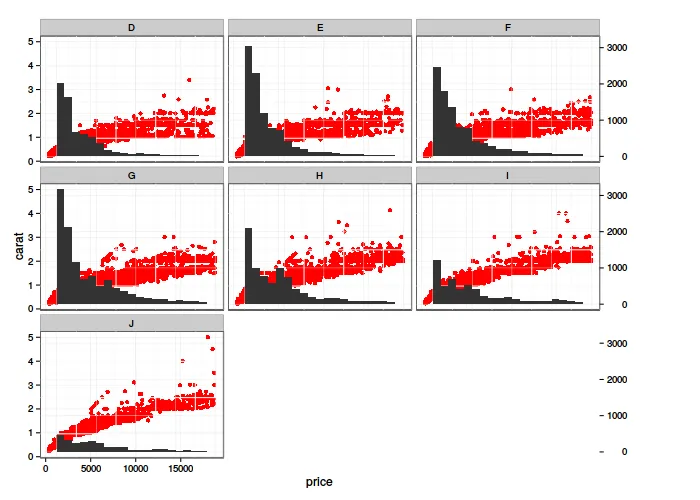
在如何在ggplot2中将转换比例尺放在右侧中,演示了通过操作和合并ggplot2对象与gtable来添加同一图中的两个y轴的方法。从那里的例子中,我设法将其扩展为适用于facet_wrap。请参见下面的示例。
然而,有三件事情不完美。
然而,有三件事情不完美。
- 标度始终放在最右边。如果与最后一行的图形连接会更好
- 如果所有绘图都单独具有y轴(即您在facet_wrap中放置了scales="free_y"),它将无效。
- 如果我保留网格线(被注释的线),第二个图形的网格线会出现在第一个图形的前面。
library(ggplot2)
library(gtable)
library(grid)

p1 <- ggplot(diamonds, aes(y=carat,x=price))
p1 <- p1 + geom_point(color="red")
p1 <- p1 + facet_wrap(~ color)
p1 <- p1 + theme_bw()  %+replace%  theme(panel.background = element_rect(fill = NA)) # use white theme and set bg to transparent so they can merge nice
#p1 <- p1 + theme(panel.grid.major = element_blank(), panel.grid.minor = element_blank()) # remove gridlines
p1


p2 <- ggplot(diamonds, aes(x=price))
p2 <- p2 + geom_histogram( binwidth = 1000)
p2 <- p2 +  facet_wrap(~ color)
p2 <- p2 + theme_bw()  %+replace%  theme(panel.background = element_rect(fill = NA))
#p2 <- p2 + theme(panel.grid.major = element_blank(), panel.grid.minor = element_blank())

p2


## Putting plots together ##################
# extract gtable
g1 <- ggplot_gtable(ggplot_build(p1))
g2 <- ggplot_gtable(ggplot_build(p2))

# overlap the panel of 2nd plot on that of 1st plot
pp <- c(subset(g1$layout, grepl("panel",name) , se = t:r))
g <- gtable_add_grob(g1, g2$grobs[grep("panel",g2$layout$name)], pp$t,
                     pp$l, pp$b, pp$l)


# axis tweaks
ia <- which(grepl("axis_l",g2$layout$name) |  grepl("axis-l",g2$layout$name)     )
ga <- g2$grobs[ia]


axis_idx <- as.numeric(which(sapply(ga,function(x) !is.null(x$children$axis))))

for(i in 1:length(axis_idx)){
  ax <- ga[[axis_idx[i]]]$children$axis
  ax$widths <- rev(ax$widths)
  ax$grobs <- rev(ax$grobs)
  ax$grobs[[1]]$x <- ax$grobs[[1]]$x - unit(1, "npc") + unit(0.15, "cm")
  g <- gtable_add_cols(g, g2$widths[g2$layout[ia[axis_idx[i]], ]$l], length(g$widths) - 1)
  g <- gtable_add_grob(g, ax, pp$t[axis_idx[i]], length(g$widths) - i, pp$b[axis_idx[i]])
}


# Plot!
grid.newpage()
grid.draw(g)