用Python从时间序列数据计算概率分布

7

我有一个关于概率分布函数的问题。我有一组时间序列数据,想要计算不同时间窗口内数据的概率分布。

我已经编写了以下代码,但是我无法找到该函数的概率分布值。

a = pd.DataFrame([0.0,
21.660332407421638,
20.56428943581567,
20.597329924045983,
19.313207915827956,
19.104973174542806,
18.031361568112377,
17.904747973652125,
16.705687654209264,
16.534206966165637,
16.347782724271802,
13.994284547628721,
12.870120434556945,
12.794530081249571,
10.660675400742669])
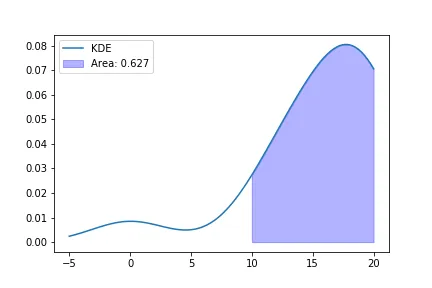
这是我的数据的直方图和密度图:
a.plot.hist()
a.plot.density()

但我不知道如何计算密度曲线下的面积值。

1个回答

8
您可以直接调用方法scipy.stats.gaussian_kde,该方法也被pandas内部使用。 该方法返回所需的函数。 然后,您可以调用scipy.integrate中的方法之一来计算核密度估计下的面积,例如:
from scipy import stats, integrate

kde = stats.gaussian_kde(a[0])

# Calculate the integral of the kde between 10 and 20:
xmin, xmax = 10, 20
integral, err = integrate.quad(kde, xmin, xmax)

x = np.linspace(-5,20,100)
x_integral = np.linspace(xmin, xmax, 100)

plt.plot(x, kde(x), label="KDE")
plt.fill_between(x_integral, 0, kde(x_integral),
                 alpha=0.3, color='b', label="Area: {:.3f}".format(integral))
plt.legend()

enter image description here


网页内容由stack overflow 提供, 点击上面的
可以查看英文原文,
原文链接