我正在尝试使用Rstudio R版本3.5.1在Mac上创建一个单一图表,其中包含我的numeric_var的2个重叠的平滑密度图,分层于我的factor_var。我总是得到相同的错误提示:
错误:
"Aesthetics must be either length 1 or the same as the data (): x, fill"
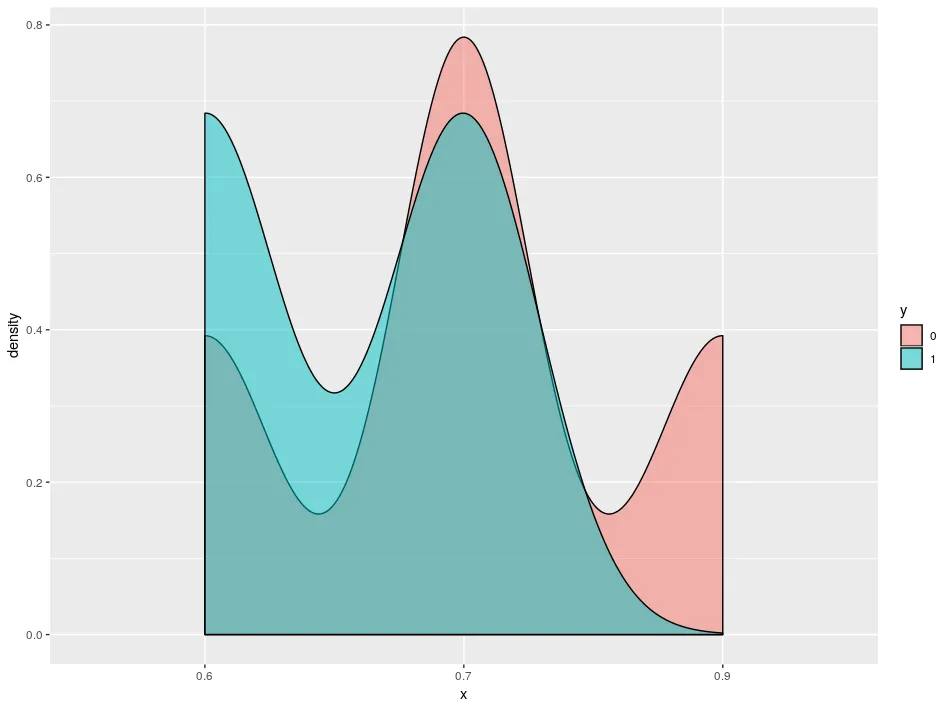
我尝试了多种方法(以下是其中一个示例)。我还遵循了 指南 - STHDA,删除了NA并检查了其他与此错误相关的问题,但我无法使其工作。这就是我想要的:
请帮忙吗?(我是新手,第一个问题,请友善 :))
数据
mydata <- fulldata %>%
    select(numeric_var,factor_var) %>%
    filter(factor_var== 0 | factor_var== 1)
head(mydata)

   numeric_var factor_var
1          0.6          0
2          0.7          0
3          0.7          1
4          0.9          0
5          0.6          1
6          0.7          0
绘图代码
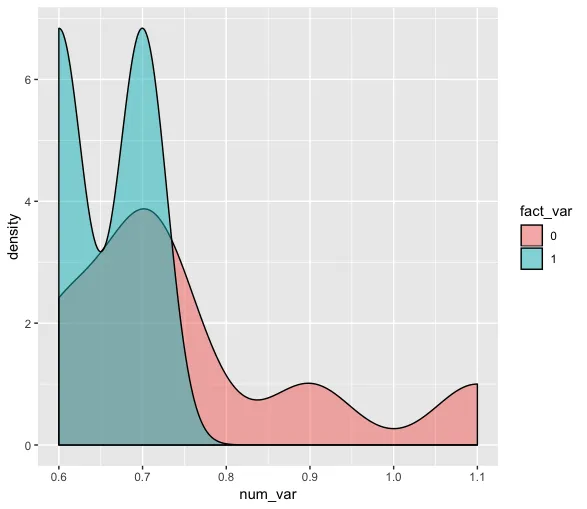
ggplot(mydata, aes(x = numeric_var, fill = factor_var)) +
    geom_density(alpha = 0.5)
错误:
Aesthetics must be either length 1 or the same as the data (598): x, fill
dput()分享您数据的样本(不要用str或head或图片/截图),以便其他人可以提供帮助。更多信息请查看这里:https://dev59.com/eG025IYBdhLWcg3whGSx?rq=1 - Tung