我希望创建一个绘图,其中X值是测量数据的子集,Y值是另一个测量数据的子集。
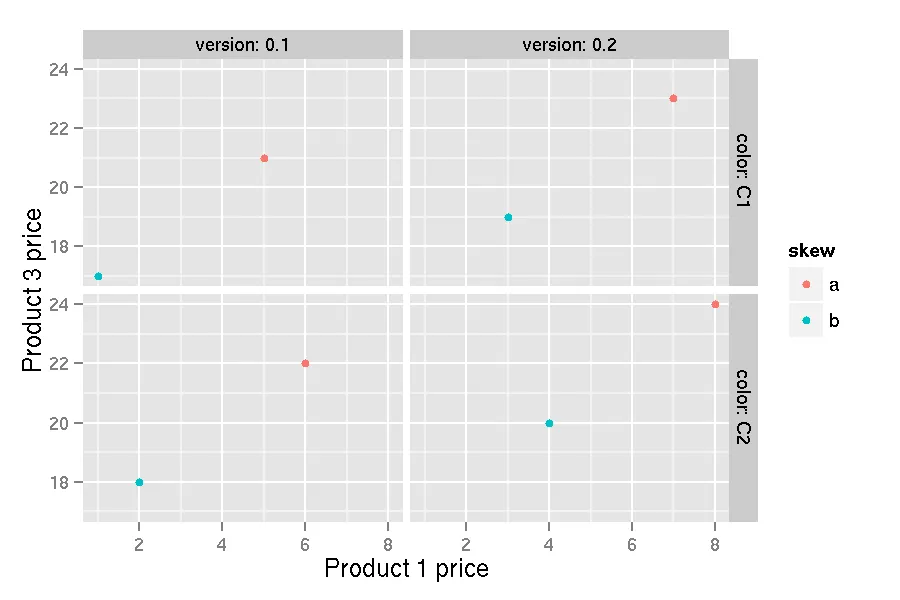
以下示例中,我有4个产品p1、p2、p3和p4。每个产品都根据其偏斜度、颜色和版本进行定价。 我想创建一个多面板图,将P3产品(Y轴)与P1产品(X轴)相对比。
下面是我的尝试,但出现了以下错误:
Error: Aesthetics must either be length one, or the same length as the dataProblems:subset(price, product == "p1"), subset(price, product == "p3")
library(ggplot2)
product=c("p1","p1","p1","p1","p1","p1","p1","p1","p2","p2","p2","p2","p2","p2","p2","p2","p3","p3","p3","p3","p3","p3","p3","p3","p4","p4","p4","p4","p4","p4","p4","p4")
skew=c("b","b","b","b","a","a","a","a","b","b","b","b","a","a","a","a","b","b","b","b","a","a","a","a","b","b","b","b","a","a","a","a")
version=c(0.1,0.1,0.2,0.2,0.1,0.1,0.2,0.2,0.1,0.1,0.2,0.2,0.1,0.1,0.2,0.2,0.1,0.1,0.2,0.2,0.1,0.1,0.2,0.2,0.1,0.1,0.2,0.2,0.1,0.1,0.2,0.2)
color=c("C1","C2","C1","C2","C1","C2","C1","C2","C1","C2","C1","C2","C1","C2","C1","C2","C1","C2","C1","C2","C1","C2","C1","C2","C1","C2","C1","C2","C1","C2","C1","C2")
price=c(1,2,3,4,5,6,7,8,9,10,11,12,13,14,15,16,17,18,19,20,21,22,23,24,25,26,27,28,29,30,31,32)
df = data.frame(product, skew, version, color, price)
# First plot all the data
p1 <- ggplot(df, aes(x=price, y=price, colour=factor(skew))) + geom_point(size=2, shape=19)
p1 <- p1 + facet_grid(version ~ color)
p1 # This gavea very good plot. So far so good
# Now plot P3 vs P1
p1 <- ggplot(df, aes(x=subset(price, product=='p1'), y=subset(price, product=='p3'), colour=factor(skew))) + geom_point(size=2, shape=19)
p1
# failed with: Error: Aesthetics must either be length one, or the same length as the dataProblems:subset(price, product == "p1"), subset(price, product == "p3")
这是我期望的结果:
subset(df$price, df$product=='p1')。它等同于df$price[df$product == 'p1']。 - David Robinsonskew在colour=factor(skew)中没有被子集化,因此长度不正确。 - David Robinson