1个回答
4
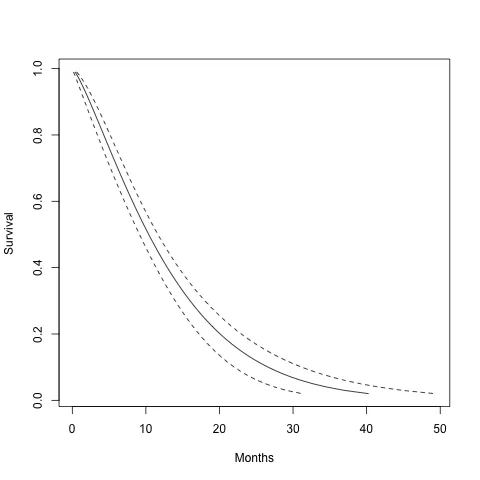
根据帮助页面中的示例,预测肺部$年龄均值和肺部$ ph.ecog众数的假设个体的生存曲线绘制如下:
?predict.survreg
pct <- 1:98/100
ptime <- predict(res, newdata=data.frame(ph.ecog=1, age=62.44737, sex=1),  type='quantile',
                  p=pct, se=TRUE)
 matplot(cbind(ptime$fit, ptime$fit + 2*ptime$se.fit,
                          ptime$fit - 2*ptime$se.fit)/30.5, 1-pct,
         xlab="Months", ylab="Survival", type='l', lty=c(1,2,2), col=1)
- IRTFM
4
网页内容由stack overflow 提供, 点击上面的可以查看英文原文,
原文链接
原文链接
lines函数还是相同的predict函数并加上add=TRUE参数呢? - user08041991predict.survreg,然后使用matlines,也许使用不同的col参数。 - IRTFMexpand.grid应用于您的X值。如果标题中包含字符串“surv”或标签[survival-analysis],我会看到它。 - IRTFM