你提供的
第一个链接实际上有关于这个理论的清晰解释和美妙的例子。(谢谢你提供这个好资源,我会在自己的工作中使用它。)
为了使用
curve函数,你需要将一些函数作为参数传递。虽然
*weibull函数族使用不同的参数化来描述Weibull函数,但正如你在第一个链接中所解释的那样,可以很容易地转换。此外,在
survreg的文档中也有相关说明:
There are multiple ways to parameterize a Weibull distribution. The survreg
function imbeds it in a general location-scale familiy, which is a
different parameterization than the rweibull function, and often leads
to confusion.
  survreg's scale  =    1/(rweibull shape)
  survreg's intercept = log(rweibull scale)
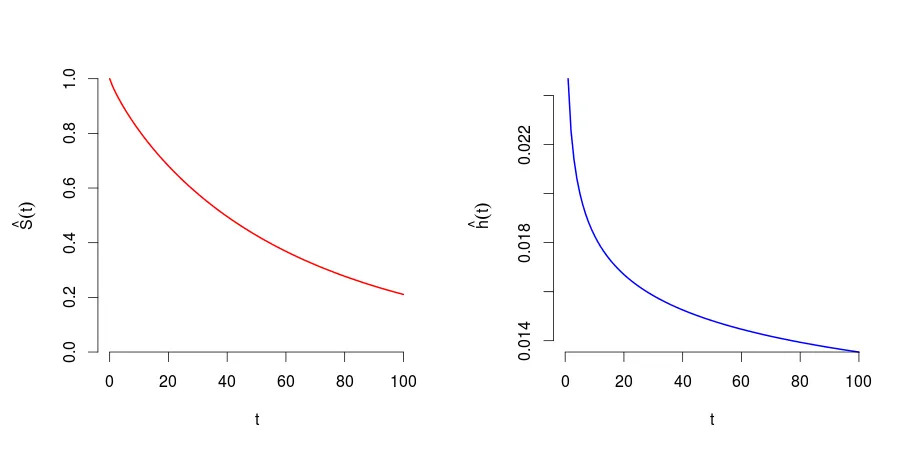
这是一个简单转换的实现例子:
intercept<-4.0961
scale<-1.15
par(mfrow=c(1,2),mar=c(5.1,5.1,4.1,2.1))
curve(pweibull(x, scale=exp(intercept), shape=1/scale, lower.tail=FALSE),
from=0, to=100, col='red', lwd=2, ylab=expression(hat(S)(t)), xlab='t',bty='n',ylim=c(0,1))
curve(dweibull(x, scale=exp(intercept), shape=1/scale)
/pweibull(x, scale=exp(intercept), shape=1/scale, lower.tail=FALSE),
from=0, to=100, col='blue', lwd=2, ylab=expression(hat(h)(t)), xlab='t',bty='n')
par(mfrow=c(1,1),mar=c(5.1,4.1,4.1,2.1))
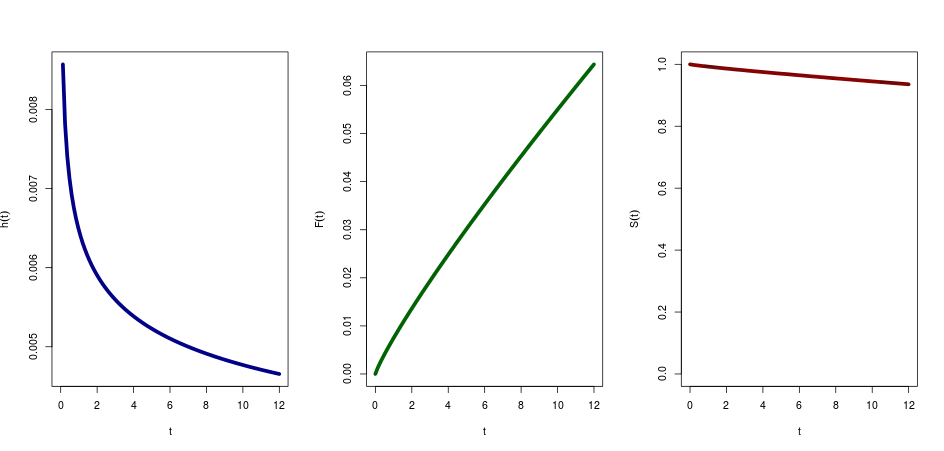
我理解您在答案中提到不想使用pweibull函数,但我猜测您的原因是它使用了不同的参数化方法。否则,您可以编写自己的版本的pweibull函数,该函数使用survreg的参数化方法:
my.weibull.surv<-function(x,intercept,scale) pweibull(x,scale=exp(intercept),shape=1/scale,lower.tail=FALSE)
my.weibull.haz<-function(x,intercept,scale) dweibull(x, scale=exp(intercept), shape=1/scale) / pweibull(x,scale=exp(intercept),shape=1/scale,lower.tail=FALSE)

curve(my.weibull.surv(x,intercept,scale),1,100,lwd=2,col='red',ylim=c(0,1),bty='n')
curve(my.weibull.haz(x,intercept,scale),1,100,lwd=2,col='blue',bty='n')
正如我在评论中提到的,我不知道你为什么要这样做(除非这是作业),但如果你愿意的话,你可以手动编写pweibull和dweibull:
my.dweibull <- function(x,shape,scale) (shape/scale) * (x/scale)^(shape-1) * exp(- (x/scale)^shape)
my.pweibull <- function(x,shape,scale) exp(- (x/scale)^shape)
这些定义直接来自于?dweibull。现在只需要将那些速度较慢、未经测试的函数包装起来,而不是直接使用pweibull和dweibull。
*weibull函数。是否可能将风险表达为Intercept、age(+其他协变量)和scale的函数? - user1252482pweibull包装器的函数。我不知道为什么你想重写pweibull,因为它是用C编码的,速度非常快,并且经过了很好的测试。除非这只是作业。无论如何,我会向你展示如何手动编写pweibull和dweibull。 - nograpes