我正在尝试将Weibull模型拟合和绘制到生存数据中。数据只有一个协变量,即队列,从2006年到2010年。那么,您有什么想法可以添加到以下两行代码中,以绘制2010年队列的生存曲线?
library(survival)
s <- Surv(subSetCdm$dur,subSetCdm$event)
sWei <- survreg(s ~ cohort,dist='weibull',data=subSetCdm)
使用Cox PH模型实现相同的任务相当简单,只需使用以下代码即可。问题在于survfit()不接受survreg类型的对象。
sCox <- coxph(s ~ cohort,data=subSetCdm)
cohort <- factor(c(2010),levels=2006:2010)
sfCox <- survfit(sCox,newdata=data.frame(cohort))
plot(sfCox,col='green')
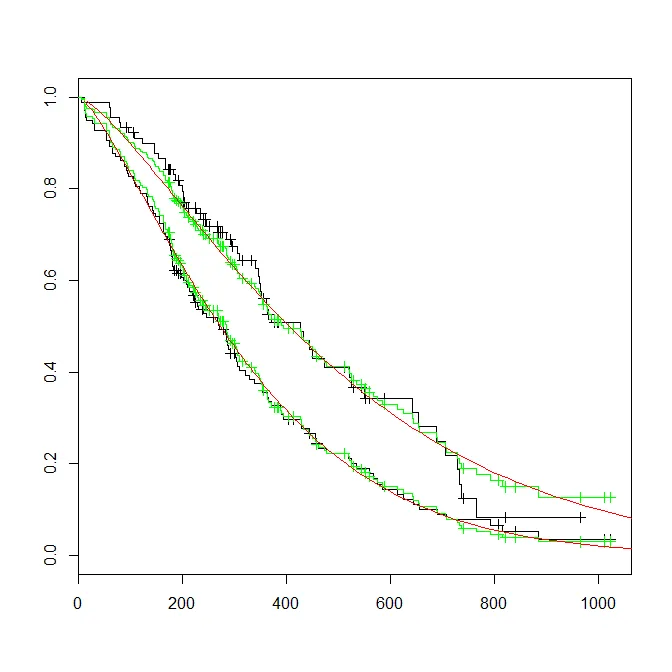
使用survival包中的lung数据,这是我想要完成的目标。
#create a Surv object
s <- with(lung,Surv(time,status))
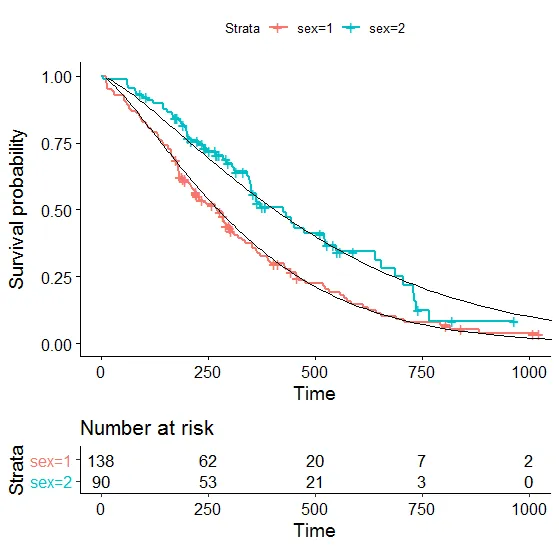
#plot kaplan-meier estimate, per sex
fKM <- survfit(s ~ sex,data=lung)
plot(fKM)
#plot Cox PH survival curves, per sex
sCox <- coxph(s ~ as.factor(sex),data=lung)
lines(survfit(sCox,newdata=data.frame(sex=1)),col='green')
lines(survfit(sCox,newdata=data.frame(sex=2)),col='green')
#plot weibull survival curves, per sex, DOES NOT RUN
sWei <- survreg(s ~ as.factor(sex),dist='weibull',data=lung)
lines(survfit(sWei,newdata=data.frame(sex=1)),col='red')
lines(survfit(sWei,newdata=data.frame(sex=2)),col='red')
?predict.survreg中有示例。 - Vincent Zoonekynd