借鉴另一个线程的建议 (@EnricoGiampieri's answer to cumulative distribution plots python),我编写了以下代码:
# plot cumulative density function of nearest nbr distances
# evaluate the histogram
values, base = np.histogram(nearest, bins=20, density=1)
#evaluate the cumulative
cumulative = np.cumsum(values)
# plot the cumulative function
plt.plot(base[:-1], cumulative, label='data')
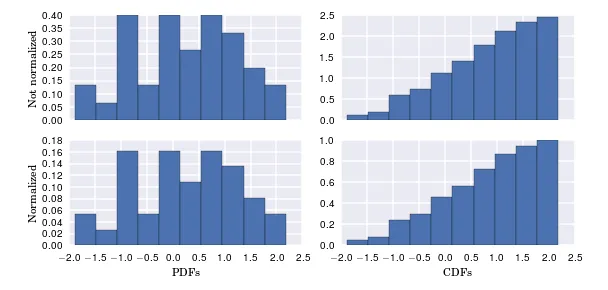
我从 np.histogram 的文档中获取了 density=1,文档说:
"请注意,直方图值的总和将不等于1,除非选择单位宽度的箱子;它不是概率质量函数。"
确实,当绘制出来时,它们并不总和为1。但是,我不理解什么是 "单位宽度的箱子"。当我将箱子设为1时,当然会得到一个空图表;当我将它们设置为人口数量时,我没有得到总和为1(类似于0.2)。当我使用建议的40个箱子时,它们总和约为0.006。
有人能给我一些指导吗?谢谢!
np.arange(0, 1005, 10)的bins时,我只需要将所有内容乘以10。我还没有检查过,但似乎你只需要将密度乘以差异因子,这在我的情况下是10。 - A.Ametov