Seaborn箱线图在x轴上偏移错误

7
from matplotlib import pyplot as plt
import pandas as pd
import seaborn as sns

df = pd.DataFrame({})
df[soi_name]=soi
df[outcome_name]=outcome
soi,outcome = utils.format_cols(soi, outcome,'continuous',agg_method)
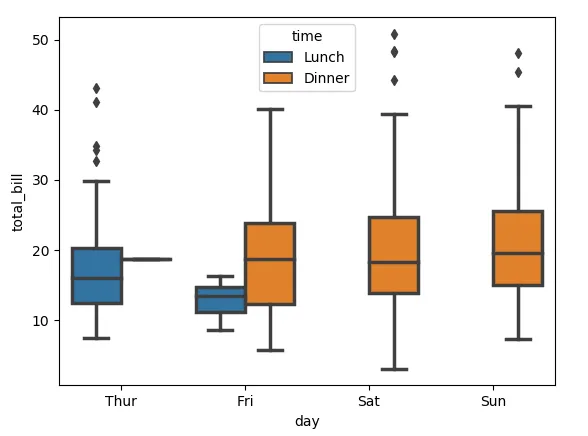
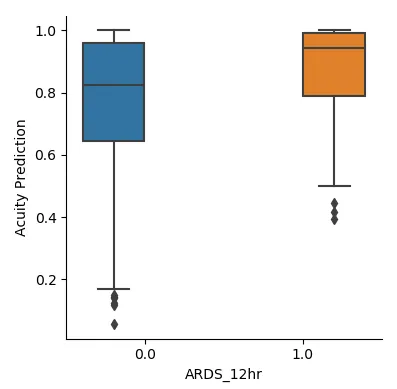
sns.factorplot(data=df, x=outcome_name,y=soi_name,hue=outcome_name,kind='box')
plt.savefig(ofilepath)

enter image description here

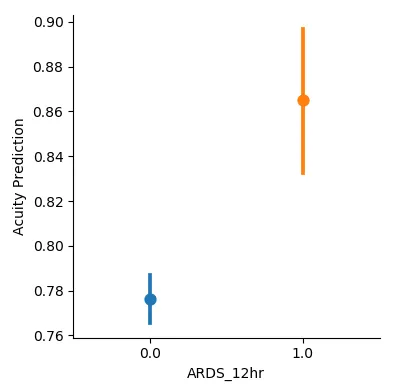
因此,用于生成此箱线图的代码片段位于上方。outcome是一个二元浮点型pandas序列,soi是一个浮点型pandas序列。这个x轴的偏移发生在箱线图和小提琴图中。当我使用以下代码生成因子图时:

df = pd.DataFrame({})
df[soi_name]=soi
df[outcome_name]=outcome
sns.factorplot(data=df, x=outcome_name,y=soi_name,hue=outcome_name)
plt.savefig(ofilepath)

... enter image description here

我得到了我想要的输出。有任何想法为什么箱线图的移动会发生?
1个回答

9
你有两个不同的色调,第一个绘制在位置的左侧,第二个绘制在位置的右侧。这通常是期望的,例如请参见文档中的此图。

enter image description here

import matplotlib.pyplot as plt
import seaborn as sns

tips = sns.load_dataset("tips")
ax = sns.boxplot(x="day", y="total_bill", hue="time",
                  data=tips, linewidth=2.5)

plt.show()

这里,您不希望蓝色和橙色的箱线图重叠,对吗?
但是如果您愿意,可以这样做。使用dodge=False参数来实现此目的。

enter image description here

import matplotlib.pyplot as plt
import seaborn as sns

tips = sns.load_dataset("tips")
ax = sns.boxplot(x="day", y="total_bill", hue="time",
                  dodge=False, data=tips, linewidth=2.5)

plt.show()

完美地工作了。非常感谢!! - LogCapy

网页内容由stack overflow 提供, 点击上面的
可以查看英文原文,
原文链接