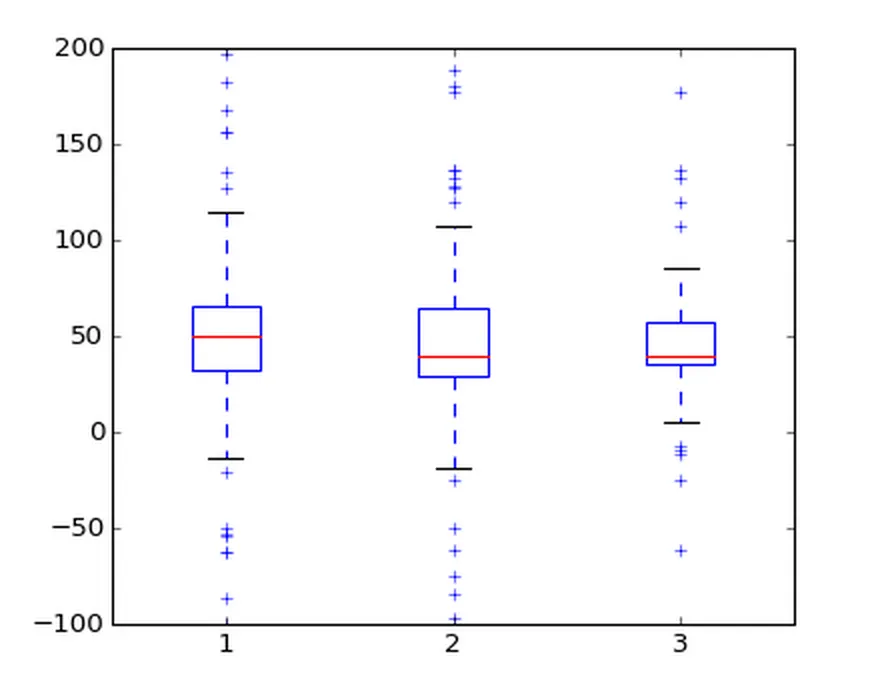
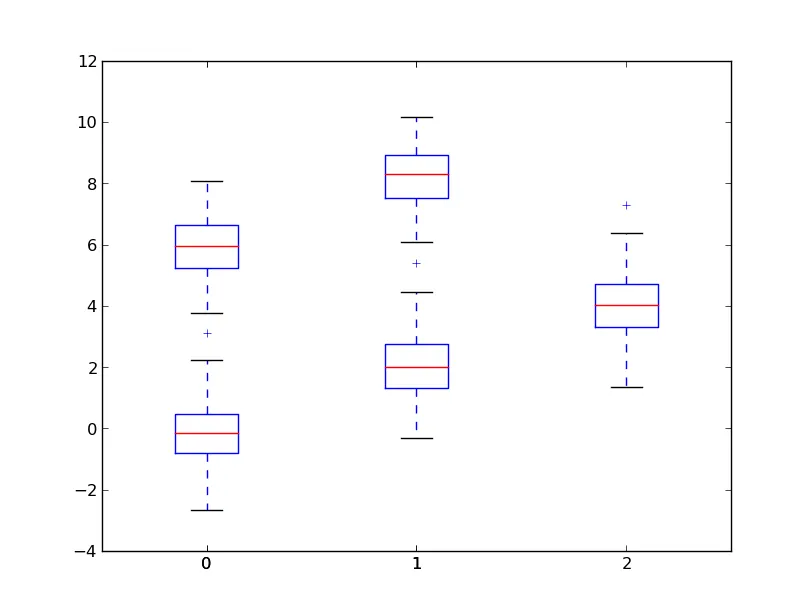
要控制箱线图的x轴位置,请使用positions参数。
例如:
import numpy as np
import matplotlib.pyplot as plt

dists = [np.random.normal(i, 1, 100) for i in range(0, 10, 2)]

fig, ax = plt.subplots()
ax.boxplot(dists, positions=[0, 1, 2, 0, 1])
plt.show()
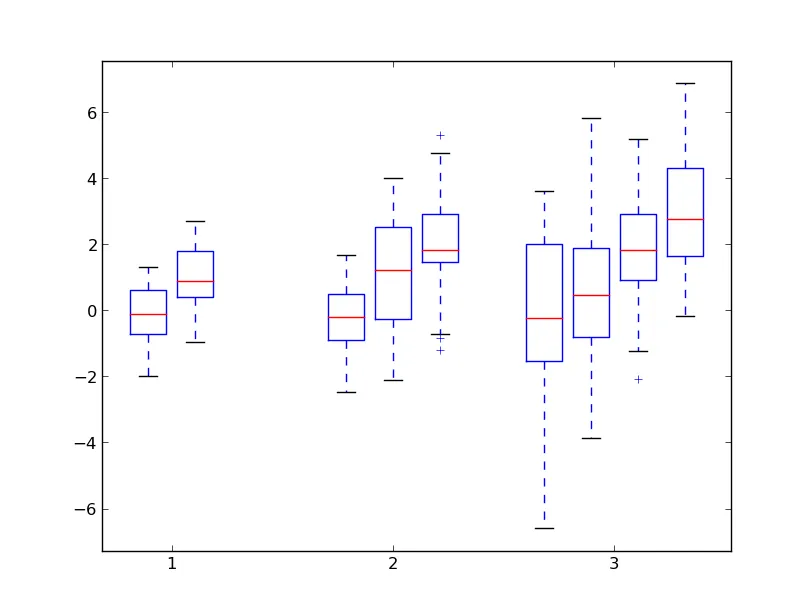
如果你想让这些组并排显示,你需要自己计算它们的位置。其中一种方法是:
def grouped_boxplots(data_groups, ax=None, max_width=0.8, pad=0.05, **kwargs):
    if ax is None:
        ax = plt.gca()

    max_group_size = max(len(item) for item in data_groups)
    total_padding = pad * (max_group_size - 1)
    width = (max_width - total_padding) / max_group_size
    kwargs['widths'] = width

    def positions(group, i):
        span = width * len(group) + pad * (len(group) - 1)
        ends = (span - width) / 2
        x = np.linspace(-ends, ends, len(group))
        return x + i

    artists = []
    for i, group in enumerate(data_groups, start=1):
        artist = ax.boxplot(group, positions=positions(group, i), **kwargs)
        artists.append(artist)

    ax.margins(0.05)
    ax.set(xticks=np.arange(len(data_groups)) + 1)
    ax.autoscale()
    return artists
以下是使用它的一个快速示例:
data = [[np.random.normal(i, 1, 30) for i in range(2)],
        [np.random.normal(i, 1.5, 30) for i in range(3)],
        [np.random.normal(i, 2, 30) for i in range(4)]]

grouped_boxplots(data)
plt.show()
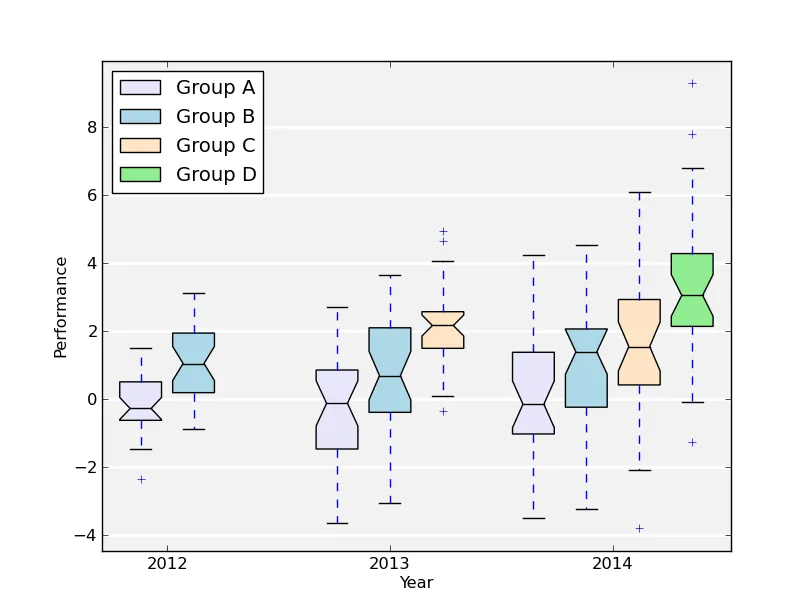
...为了展示一个过于花哨的例子:
(注:此处无需翻译html标签)
import numpy as np
import matplotlib.pyplot as plt

def main():
    data = [[np.random.normal(i, 1, 30) for i in range(2)],
            [np.random.normal(i, 1.5, 30) for i in range(3)],
            [np.random.normal(i, 2, 30) for i in range(4)]]

    fig, ax = plt.subplots()
    groups = grouped_boxplots(data, ax, max_width=0.9,
                              patch_artist=True, notch=True)

    colors = ['lavender', 'lightblue', 'bisque', 'lightgreen']
    for item in groups:
        for color, patch in zip(colors, item['boxes']):
            patch.set(facecolor=color)

    proxy_artists = groups[-1]['boxes']
    ax.legend(proxy_artists, ['Group A', 'Group B', 'Group C', 'Group D'],
              loc='best')
    ax.set(xlabel='Year', ylabel='Performance', axisbelow=True,
           xticklabels=['2012', '2013', '2014'])

    ax.grid(axis='y', ls='-', color='white', lw=2)
    ax.patch.set(facecolor='0.95')
    plt.show()

def grouped_boxplots(data_groups, ax=None, max_width=0.8, pad=0.05, **kwargs):
    if ax is None:
        ax = plt.gca()

    max_group_size = max(len(item) for item in data_groups)
    total_padding = pad * (max_group_size - 1)
    width = (max_width - total_padding) / max_group_size
    kwargs['widths'] = width

    def positions(group, i):
        span = width * len(group) + pad * (len(group) - 1)
        ends = (span - width) / 2
        x = np.linspace(-ends, ends, len(group))
        return x + i

    artists = []
    for i, group in enumerate(data_groups, start=1):
        artist = ax.boxplot(group, positions=positions(group, i), **kwargs)
        artists.append(artist)

    ax.margins(0.05)
    ax.set(xticks=np.arange(len(data_groups)) + 1)
    ax.autoscale()
    return artists

main()