我正在重新创建区域地图的例子,并尝试添加一个滑动条。当拖动时,会按年份更改。另一位用户问了类似的问题,但没有得到回复。我进行了更多搜索,并找到了一个示例,其中用户为附加年份生成了随机值,并创建了一个滑块,但它是用JavaScript编写的,我不确定如何将其翻译成Python。
有没有一种在Python中实现这个的方法?
以下是JavaScript的代码:
Plotly.d3.csv('https://raw.githubusercontent.com/plotly/datasets/master/2011_us_ag_exports.csv', function(err, rows){
  function unpack(rows, key) {
    return rows.map(function(row) { return row[key]; });
  }

  var randomize = z => z.map(d => Math.pow(Math.random(), 2) * 30000);
  var data = unpack(rows, 'total exports');
  var frames = [{
    data: [{z: unpack(rows, 'total exports')}],
    traces: [0],
    name: '1990',
    layout: {title: '1990 US Agriculture Exports by State'}
  }, {
    data: [{z: randomize(data)}],
    traces: [0],
    name: '1995',
    layout: {title: '1995 US Agriculture Exports by State'}
  }, {
    data: [{z: randomize(data)}],
    traces: [0],
    name: '2000',
    layout: {title: '2000 US Agriculture Exports by State'}
  }, {
    data: [{z: randomize(data)}],
    traces: [0],
    name: '2005',
    layout: {title: '2005 US Agriculture Exports by State'}
  }]

  var data = [{
    type: 'choropleth',
    locationmode: 'USA-states',
    locations: unpack(rows, 'code'),
    z: unpack(rows, 'total exports'),
    text: unpack(rows, 'state'),
    zmin: 0,
    zmax: 17000,
    colorscale: [
      [0, 'rgb(242,240,247)'], [0.2, 'rgb(218,218,235)'],
      [0.4, 'rgb(188,189,220)'], [0.6, 'rgb(158,154,200)'],
      [0.8, 'rgb(117,107,177)'], [1, 'rgb(84,39,143)']
    ],
    colorbar: {
      title: 'Millions USD',
      thickness: 0.2
    },
    marker: {
      line:{
        color: 'rgb(255,255,255)',
        width: 2
      }
    }
  }];


  var layout = {
    title: '1990 US Agriculture Exports by State',
    geo:{
      scope: 'usa',
      showlakes: true,
      lakecolor: 'rgb(255,255,255)'
    },
    xaxis: {autorange: false},
    yaxis: {autorange: false},
    sliders: [{
      currentvalue: {
        prefix: 'Year: ',
      },
      steps: frames.map(f => ({
        label: f.name,
        method: 'animate',
        args: [[f.name], {frame: {duration: 0}}]
      }))
    }]
  };

  Plotly.plot('graph', {
    data: data,
    layout: layout,
    frames: frames,
    config: {showLink: false}
  });
});
有没有一种在Python中实现这个的方法?
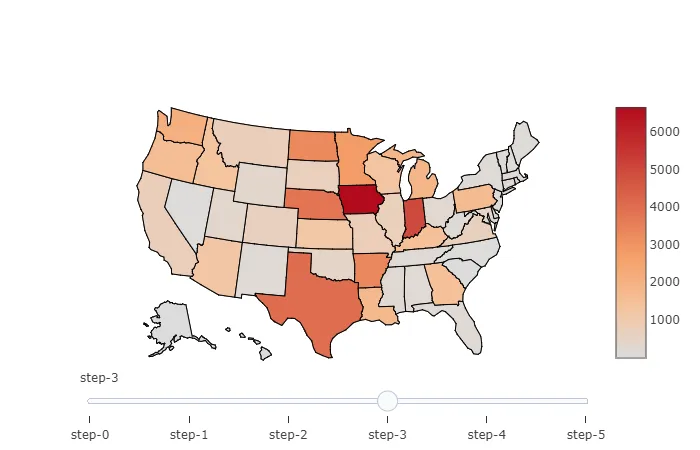
step-0,并且将步骤标记为1990年? - ottehenglabel='Year {}'.format(i + 1980)添加到step字典中,参见更新后的答案。 - Maximilian Petersargs=['visible', [False] * len(data)]。 - otteheng