使用Plotly创建带有滑块的交互式图表

3

如何使用Plotly在Python中重新创建以下交互式图形?

我的简单示例绘制了一个柱状图,其中包含一个列x和另一个列1-x。

Mathematica中的GIF:

enter image description here

滑块允许在0到1之间变化x。

Mathematica代码:

Manipulate[BarChart[{x, 1 - x}, PlotRange -> {0, 1}], 
    {{x, 0.3, "Level"}, 0, 1, Appearance -> "Open"}]

更新

下面是我不喜欢的解决方案:

import plotly.graph_objs as go
from plotly.offline import init_notebook_mode, iplot
init_notebook_mode(connected=True)

import ipywidgets as widgets

绘图:

def update_plot(x):
    data = [go.Bar(
                x=['1', '2'],
                y=[x, 1-x]
    )]
    iplot(data, show_link=False)

x = widgets.FloatSlider(min=0, max=1, value=0.3)
widgets.interactive(update_plot, x=x)

以下是问题:

  • 当滑块移动时,图表闪烁
  • 滑块位置不正确
  • 增量不够精细
  • 我无法自己指定精确的数值

请查看 https://plot.ly/python/sliders/ 和 https://stackoverflow.com/help/how-to-ask? 如果您对某段代码有特定问题,Stackoverflow社区将乐意提供帮助。 - Maximilian Peters
1
我认为这个问题非常具体。你发给我的文档非常差。如果你选择通过示例来解释某些东西,至少要展示更多的例子。 - Sandu Ursu
1
是的,从一般的观点来看,这个问题相当具体。然而,在 SO 的上下文中,它实际上是相当广泛的。你有阅读过【提问的正确姿势】维基页面吗?去那里看看,你会发现向社区寻求此类问题的解决方案并不受欢迎。我建议对手头的主题进行更广泛的搜索,因为这似乎是一个相当琐碎的情况,肯定有人在过去已经解决了这个问题。 - Gabriel Jablonski
2个回答

7

从 Plotly 3.0 开始,可以通过以下方式实现(在 JupyterLab 中):

import plotly.graph_objects as go
from ipywidgets import interact

fig = go.FigureWidget()
bar = fig.add_bar(x=['x', '1-x'])
fig.layout = dict(yaxis=dict(range=[0,1]), height=600)

@interact(x=(0, 1, 0.01))
def update(x=0.3):
    with fig.batch_update():
        bar.y=[x, 1-x]
fig

进入图像描述


更新:

从Plotly 4.0开始,您需要指定fig.data[0].y而不是bar.y


我得到的不是一个图表,而是一个描述,即FigureWidget({'data':[{'type':'bar','uid':'a5139b4a-4b23-4938-a93b-86e0397b2495','x':['x','1-x'],... - seeker_after_truth

6
以下代码创建了一个交互式图表,使用了plotly和Dash。它需要两个输入:滑块和文本框。当将下面的代码保存为“.py”文件并在终端运行时,应该在终端中运行一个本地服务器。接下来,从此服务器复制“* Running on http://”地址并粘贴到浏览器中以打开图表。最有可能的是http://127.0.0.1:8050/。资源:123。(Python 3.6.6
重要提示:请注意,为使滑块正常工作,必须将文本框值重置为“0”。
导入库
import numpy as np
import pandas as pd
from plotly import __version__
import plotly.offline as pyo
import plotly.graph_objs as go

import dash
import dash_core_components as dcc
import dash_html_components as html
from dash.dependencies import Input, Output

创建Dash应用程序
app = dash.Dash()
app.layout = html.Div(
      html.Div([
            html.Div([html.H5("Level"),

                    dcc.Slider(id='slider_input',
                                min=0,
                                max=1,
                                step=0.005,
                                value=0.1,
                    )],style={'width': '200'}
                ),

            html.Div(style={'height': '10'}),

            html.Div(dcc.Input( id='text_input',
                        placeholder='Enter a value...',
                        type='text',
                        value=0.0
                    ),style={'width': '50'}),

            dcc.Graph(id='example',
                     figure={'data':[{'x':[1,2],
                                      'y':[0,1],
                                      'type':'bar',
                                      'marker':dict(color='#ffbf00')
                                     }],
                              'layout': go.Layout(title='Plot',
                                                  #xaxis = list(range = c(2, 5)),
                                                  yaxis=dict(range=[0, 1])
                                                   )
                               })

          ], style={'width':'500', 'height':'200','display':'inline-block'})
)

# callback - 1 (from slider)
@app.callback(Output('example', 'figure'),
             [Input('slider_input', 'value'),
             Input('text_input', 'value')])

def update_plot(slider_input, text_input):
    if (float(text_input)==0.0):
        q = float(slider_input)
    else:
        q = float(text_input)

    figure = {'data': [go.Bar(x=[1,2],
                              y=[q, 1-q],
                              marker=dict(color='#ffbf00'),
                              width=0.5
                       )],
              'layout': go.Layout(title='plot',
                                  #xaxis = list(range = c(2, 5)),
                                  yaxis=dict(range=[0, 1])
                                )
            }
    return figure

运行服务器

if __name__ == '__main__':
    app.run_server()

输出

enter image description here

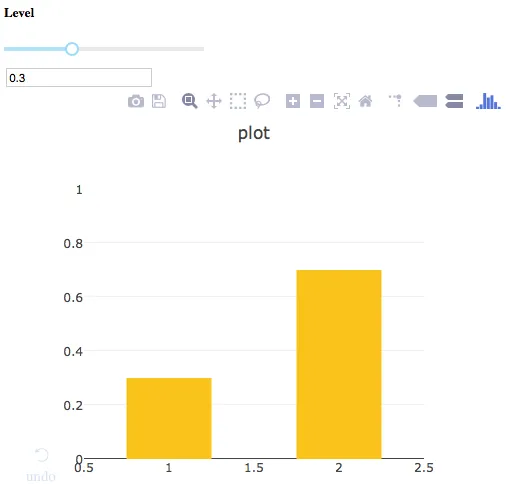
编辑 - 1 .............................
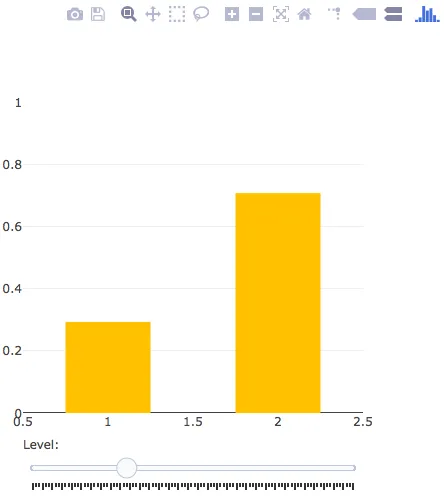
只用滑块绘制图形

以下代码使用不带dash的plotly。该图形是交互式的,带有一个滑块。请注意,此代码没有文本输入以更改图形(如上所述)。但是,下面的图应该会在滑块更新而无需“释放”滑块即可查看更新。在这个图中,为绘制创建了单个跟踪。

导入库

import pandas as pd
import numpy as np
from plotly import __version__
%matplotlib inline

import json
import plotly.offline as pyo
import plotly.graph_objs as go
from plotly.tools import FigureFactory as FF

import cufflinks as cf
from plotly.offline import download_plotlyjs, init_notebook_mode, plot, iplot 
init_notebook_mode(connected=True)

init_notebook_mode(connected=True)
cf.go_offline()

创建跟踪

traces = []
q = np.linspace(0,1, 100)
for i in range(0,len(q)):
    trace = dict(
                type = 'bar',
                visible = False,
                x=[1, 2],
                y=[q[i], 1 - q[i]],
                marker=dict(color='#ffbf00'),
                width=0.5
             )
    traces.append(trace)

traces[0]['visible'] = 'True'

创建滑块

steps=[]
for i in range(len(traces)):
    step = dict(
        method = 'restyle',  
        args = ['visible', [False] * len(traces)],
        label=""
    )
    step['args'][1][i] = True # Toggle i'th trace to "visible"
    steps.append(step)

sliders = [dict(
    active = 10,
    currentvalue = {"prefix": "Level: "},
    #pad = {"t": 50},
    steps = steps

)]

创建布局

layout = go.Layout(
    width=500,
    height=500,
    autosize=False,
    yaxis=dict(range=[0, 1])
)

layout['sliders'] = sliders

图表绘制

fig = go.Figure(data=traces, layout=layout)

#pyo.iplot(fig, show_link=False) # run this line to view inline in Jupyter Notebook
pyo.plot(fig, show_link=False) # run this line to view in browser 

enter image description here


不错!你知道如何使它具有同步更新功能吗?(即在我移动滑块时更改图表)? - Sandu Ursu
我查阅了dash的文档,似乎必须释放slider才能看到效果。(https://dash.plot.ly/dash-core-components/slider)。我在Edit-1中添加了另一段仅使用plotly的代码。这个图表中的滑块更加灵敏。请注意,此图表没有文本输入来更新图表。 - Nilesh Ingle

网页内容由stack overflow 提供, 点击上面的
可以查看英文原文,
原文链接