我使用matplotlib创建了一些基于8个变量的图,希望能够研究当我更改其中一些变量时该图如何变化。我编写了一些脚本来调用matplotlib并生成不同的快照,之后将其转换为电影,效果还不错,但有点笨拙。
我想知道是否有办法通过键盘按键与图形重新生成进行交互,以增加/减少某些变量的值并即时查看图形变化。
最佳方法是什么?
如果您能向我指出有趣的链接或一个只有两个滑块的绘图示例的链接,那就更好了。
我使用matplotlib创建了一些基于8个变量的图,希望能够研究当我更改其中一些变量时该图如何变化。我编写了一些脚本来调用matplotlib并生成不同的快照,之后将其转换为电影,效果还不错,但有点笨拙。
我想知道是否有办法通过键盘按键与图形重新生成进行交互,以增加/减少某些变量的值并即时查看图形变化。
最佳方法是什么?
如果您能向我指出有趣的链接或一个只有两个滑块的绘图示例的链接,那就更好了。
amp_slider、freq_slider 等)应该由你自己维护。from pylab import *),但它表达了要点。已经修复了示例以避免使用 pylab。)from numpy import pi, sin
import numpy as np
import matplotlib.pyplot as plt
from matplotlib.widgets import Slider, Button, RadioButtons
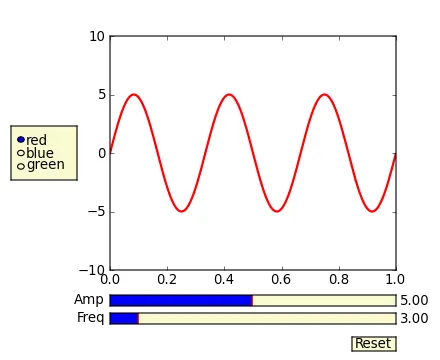
def signal(amp, freq):
return amp * sin(2 * pi * freq * t)
axis_color = 'lightgoldenrodyellow'
fig = plt.figure()
ax = fig.add_subplot(111)
# Adjust the subplots region to leave some space for the sliders and buttons
fig.subplots_adjust(left=0.25, bottom=0.25)
t = np.arange(0.0, 1.0, 0.001)
amp_0 = 5
freq_0 = 3
# Draw the initial plot
# The 'line' variable is used for modifying the line later
[line] = ax.plot(t, signal(amp_0, freq_0), linewidth=2, color='red')
ax.set_xlim([0, 1])
ax.set_ylim([-10, 10])
# Add two sliders for tweaking the parameters
# Define an axes area and draw a slider in it
amp_slider_ax = fig.add_axes([0.25, 0.15, 0.65, 0.03], facecolor=axis_color)
amp_slider = Slider(amp_slider_ax, 'Amp', 0.1, 10.0, valinit=amp_0)
# Draw another slider
freq_slider_ax = fig.add_axes([0.25, 0.1, 0.65, 0.03], facecolor=axis_color)
freq_slider = Slider(freq_slider_ax, 'Freq', 0.1, 30.0, valinit=freq_0)
# Define an action for modifying the line when any slider's value changes
def sliders_on_changed(val):
line.set_ydata(signal(amp_slider.val, freq_slider.val))
fig.canvas.draw_idle()
amp_slider.on_changed(sliders_on_changed)
freq_slider.on_changed(sliders_on_changed)
# Add a button for resetting the parameters
reset_button_ax = fig.add_axes([0.8, 0.025, 0.1, 0.04])
reset_button = Button(reset_button_ax, 'Reset', color=axis_color, hovercolor='0.975')
def reset_button_on_clicked(mouse_event):
freq_slider.reset()
amp_slider.reset()
reset_button.on_clicked(reset_button_on_clicked)
# Add a set of radio buttons for changing color
color_radios_ax = fig.add_axes([0.025, 0.5, 0.15, 0.15], facecolor=axis_color)
color_radios = RadioButtons(color_radios_ax, ('red', 'blue', 'green'), active=0)
def color_radios_on_clicked(label):
line.set_color(label)
fig.canvas.draw_idle()
color_radios.on_clicked(color_radios_on_clicked)
plt.show()
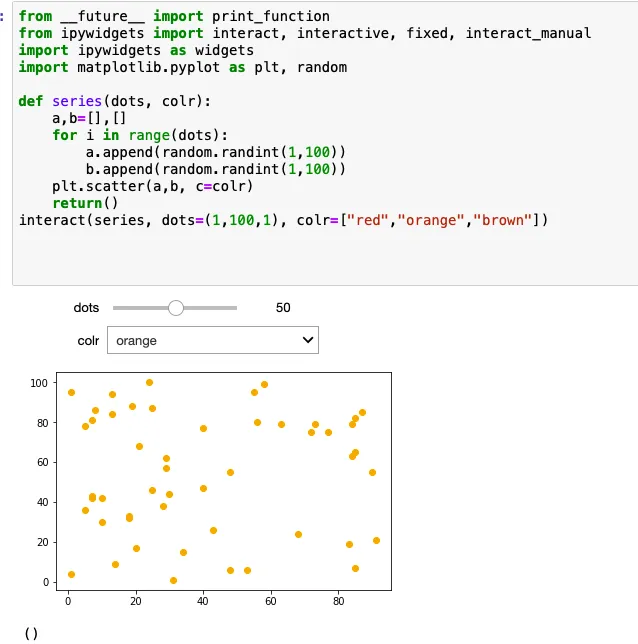
我遵循了在jupyter中检查widget的建议,它们运行得非常好。 示例代码已上传至GitHub https://github.com/LeonidBystrykh/course-python-for-beginners/blob/master/Interactive_dots.ipynb
from __future__ import print_function
from ipywidgets import interact, interactive, fixed, interact_manual
import ipywidgets as widgets
import matplotlib.pyplot as plt, random

def series(dots, colr):
    a,b=[],[]
    for i in range(dots):
        a.append(random.randint(1,100))
        b.append(random.randint(1,100))
    plt.scatter(a,b, c=colr)
    return()
interact(series, dots=(1,100,1), colr=["red","orange","brown"]);
Matplotlib有一些相当不错的GUI功能。在matplotlib的源代码压缩包中,/examples/user_interfaces和matplotlib>/examples/event_handling目录下有一些文档示例。特别是关于按键处理的示例链接为:http://matplotlib.sourceforge.net/examples/event_handling/keypress_demo.html
我已经做了一些类似于您所需求的工作:
import numpy as np
import pylab

class plotter:
    def __init__(self, initial_values):
        self.values
        self.fig = pylab.figure()
        pylab.gray()
        self.ax = self.fig.add_subplot(111)
        self.draw()
        self.fig.canvas.mpl_connect('key_press_event',self.key)

    def draw(self):
        im = your_function(self.values)
        pylab.show()
        self.ax.imshow(im)

    def key(self, event):
        if event.key=='right':
            self.values = modify()
        elif event.key == 'left':
            self.values = modify()

        self.draw()
        self.fig.canvas.draw()
对于ipython或jupyter笔记本,您可以使用ipywidgets:
from ipywidgets import *
def update(w=0,h=0):
    print(h+w)

interact(update, w= widgets.IntSlider(value=1, min=0, max=7, step=1) ,
                 h= widgets.IntSlider(value=1, min=0, max=7, step=1) );
请查看文档: https://ipywidgets.readthedocs.io/en/stable/examples/Using%20Interact.html
使用waitforbuttonpress(timeout=0.001),然后绘图将会显示您的鼠标单击。
您也可以考虑使用Quibbler包。
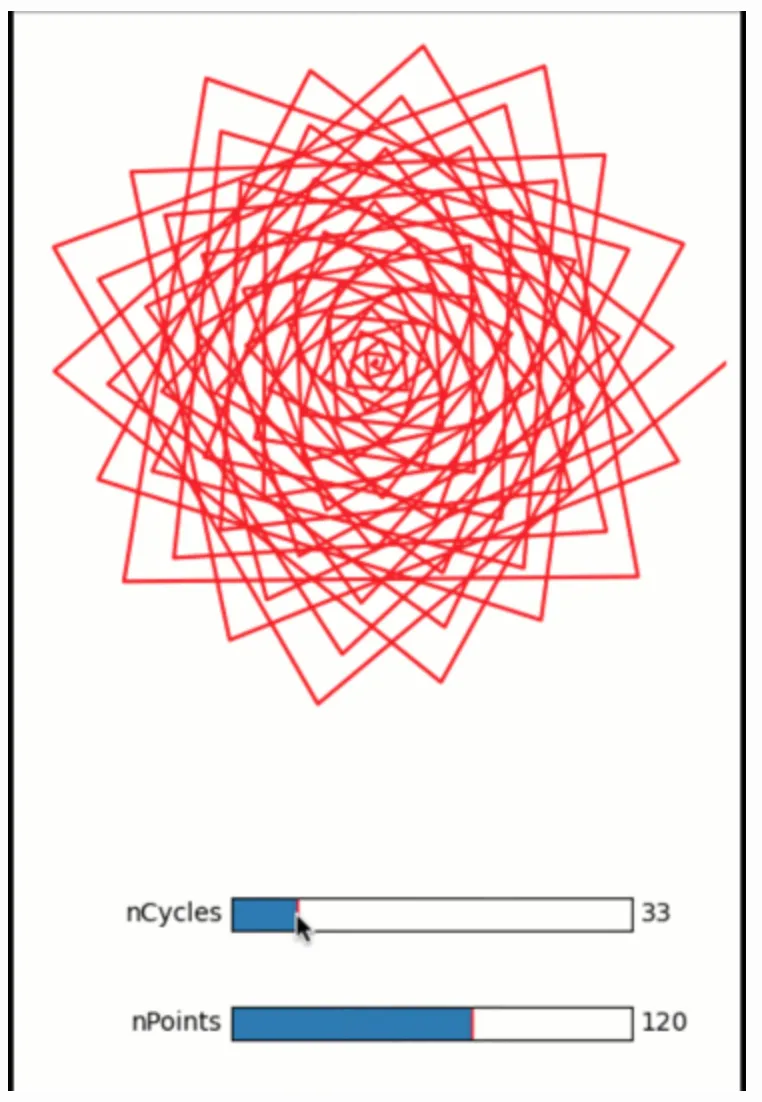
Quibbler可以自动将您的普通matplotlib图形变为交互式。无需编写回调函数。
在Quibbler文档中查看一些示例。特别是,查看带有两个滑块的绘图的具体示例。
from pyquibbler import iquib, initialize_quibbler
initialize_quibbler()
import matplotlib.pyplot as plt
from matplotlib.widgets import Slider
import numpy as np
%matplotlib tk

# Figure setup:
fig = plt.figure(figsize=(4, 6))

axs = fig.add_axes([0, 0.36, 1, 0.64])
axs.axis('square')
axs.axis((-10, 10, -10, 10))
axs.axis('off')

axs_slider1 = fig.add_axes([0.3, 0.16, 0.55, 0.03])
axs_slider2 = fig.add_axes([0.3, 0.06, 0.55, 0.03])

# Defining quib input variables:
nPoints = iquib(120)
nCycles = iquib(30)

# Define downstream function quib calculations based on the quib inputs:
phi = np.linspace(0, 2 * np.pi * nCycles, nPoints)
r = np.linspace(0, 10, nPoints)

# Plot the data:
axs.plot(r * np.cos(phi), r * np.sin(phi), 'r-')

# Create quib-linked slider widgets:
Slider(ax=axs_slider1, label='nCycles', valmin=0, valmax=200, valstep=1, valinit=nCycles)
Slider(ax=axs_slider2, label='nPoints', valmin=0, valmax=200, valstep=1, valinit=nPoints)
为了透明度:我是Quibbler的开发人员之一。
我认为仅仅使用plt.plot绘制图形是不足以实现这一点的。您需要自己编写一个自定义的GUI脚本/应用程序,并将Matplotlib嵌入其中。目前,Matplotlib支持所有主要的GUI工具包-PyGTK+、PyQt4和wxPython。
我使用wxPython,将Matplotlib嵌入其中相当容易。其他GUI工具包也应该类似。您可以在这本书中找到所有所需的信息 -

它可以在亚马逊这里购买。
ipython是一个交互式的Python shell。而ipython笔记本是一个基于Web的界面,它会将代码片段发送回ipython进行评估并返回结果。因此,ipython笔记本只会将matplotlib图形呈现为静态的.png文件,而不是弹出一个交互式窗口。使用ipython本身(或直接使用python运行脚本)将为每个matplotlib图形显示一个交互式GUI窗口。 - Joe Kington