您可以根据这个答案中的代码,添加一个滑块。
import numpy as np
import matplotlib.pyplot as plt
from matplotlib.animation import FuncAnimation
import mpl_toolkits.axes_grid1
import matplotlib.widgets
class Player(FuncAnimation):
def __init__(self, fig, func, frames=None, init_func=None, fargs=None,
save_count=None, mini=0, maxi=100, pos=(0.125, 0.92), **kwargs):
self.i = 0
self.min=mini
self.max=maxi
self.runs = True
self.forwards = True
self.fig = fig
self.func = func
self.setup(pos)
FuncAnimation.__init__(self,self.fig, self.update, frames=self.play(),
init_func=init_func, fargs=fargs,
save_count=save_count, **kwargs )
def play(self):
while self.runs:
self.i = self.i+self.forwards-(not self.forwards)
if self.i > self.min and self.i < self.max:
yield self.i
else:
self.stop()
yield self.i
def start(self):
self.runs=True
self.event_source.start()
def stop(self, event=None):
self.runs = False
self.event_source.stop()
def forward(self, event=None):
self.forwards = True
self.start()
def backward(self, event=None):
self.forwards = False
self.start()
def oneforward(self, event=None):
self.forwards = True
self.onestep()
def onebackward(self, event=None):
self.forwards = False
self.onestep()
def onestep(self):
if self.i > self.min and self.i < self.max:
self.i = self.i+self.forwards-(not self.forwards)
elif self.i == self.min and self.forwards:
self.i+=1
elif self.i == self.max and not self.forwards:
self.i-=1
self.func(self.i)
self.slider.set_val(self.i)
self.fig.canvas.draw_idle()
def setup(self, pos):
playerax = self.fig.add_axes([pos[0],pos[1], 0.64, 0.04])
divider = mpl_toolkits.axes_grid1.make_axes_locatable(playerax)
bax = divider.append_axes("right", size="80%", pad=0.05)
sax = divider.append_axes("right", size="80%", pad=0.05)
fax = divider.append_axes("right", size="80%", pad=0.05)
ofax = divider.append_axes("right", size="100%", pad=0.05)
sliderax = divider.append_axes("right", size="500%", pad=0.07)
self.button_oneback = matplotlib.widgets.Button(playerax, label='$\u29CF$')
self.button_back = matplotlib.widgets.Button(bax, label='$\u25C0$')
self.button_stop = matplotlib.widgets.Button(sax, label='$\u25A0$')
self.button_forward = matplotlib.widgets.Button(fax, label='$\u25B6$')
self.button_oneforward = matplotlib.widgets.Button(ofax, label='$\u29D0$')
self.button_oneback.on_clicked(self.onebackward)
self.button_back.on_clicked(self.backward)
self.button_stop.on_clicked(self.stop)
self.button_forward.on_clicked(self.forward)
self.button_oneforward.on_clicked(self.oneforward)
self.slider = matplotlib.widgets.Slider(sliderax, '',
self.min, self.max, valinit=self.i)
self.slider.on_changed(self.set_pos)
def set_pos(self,i):
self.i = int(self.slider.val)
self.func(self.i)
def update(self,i):
self.slider.set_val(i)
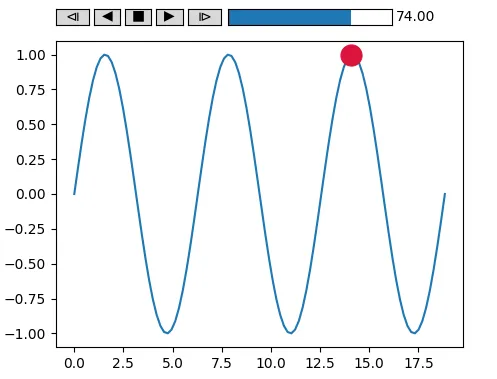
fig, ax = plt.subplots()
x = np.linspace(0,6*np.pi, num=100)
y = np.sin(x)
ax.plot(x,y)
point, = ax.plot([],[], marker="o", color="crimson", ms=15)
def update(i):
point.set_data(x[i],y[i])
ani = Player(fig, update, maxi=len(y)-1)
plt.show()
ur'$\u29CF$'更改为'$\u29CF$',以便在Python 3.7中使示例运行时不出现语法错误,不确定规则的确切变化。否则一切正常。 - Bas Swinckels