我有一张灰度图像,像素值在0(黑色)和255(白色)之间。我有一个与灰度图像相同大小的目标矩阵。我需要从灰度图像中的随机像素开始,以深度优先搜索的方式逐个遍历图像中的每个像素,并将其值复制到目标矩阵中的相应位置。显然,我只需对非白色像素执行此操作。我想过可以获取灰度图像的连通分量,并逐个像素遍历每个分量,但我找不到任何合适的连通分量实现。有什么想法吗?
例如,如果我的灰度图像是:
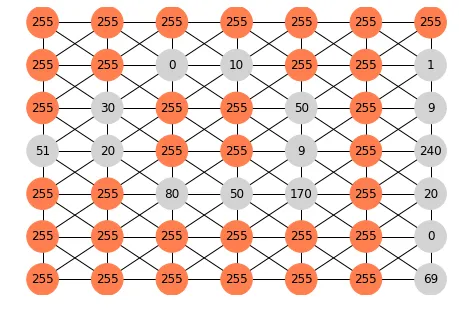
[[255,255,255,255,255,255,255]
[255,255, 0 ,10 ,255,255, 1 ]
[255,30 ,255,255,50 ,255, 9 ]
[51 ,20 ,255,255, 9 ,255,240]
[255,255,80 ,50 ,170,255, 20]
[255,255,255,255,255,255, 0 ]
[255,255,255,255,255,255, 69]]
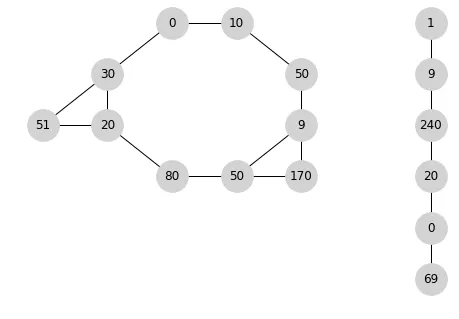
一种可能的遍历顺序是[0,10,50,9,170,50,80,20,51,30],然后跟随[1,9,240,20,0,69],得到[0,10,50,9,170,50,80,20,51,30,1,9,240,20,0,69]。不同对象之间的顺序不重要。
其他可能的遍历顺序包括:[1,9,240,20,0,69,0,10,50,9,170,50,80,20,51,30]或[1,9,240,20,0,69,0,10,50,9,170,50,80,20,30,51]或[1,9,240,20,0,69,10,50,9,170,50,80,20,30,0,51]
等等。