我有两个2D的numpy数组(尺寸相同),并且使用matplotlib进行绘图。第一个数组我已经用灰度色图绘制出来了。而对于第二个数组,它代表着一个光圈,但是它的形状是不规则的(一些像素被描边,是一组水平和垂直线条组成的轮廓)。我不确定如何让它绘制这第二个数组。该数组由三个数字(0、1和3)组成,我只需要一个值(3)的像素被描边,但我需要描边将这些像素所在的区域包围起来,而不是每个像素单独描边。我需要所有像素的内部保持透明,以便我可以看到灰度色图的颜色。请问有人知道如何实现吗?
在图表中勾勒出一个区域。
4
- Palmetto_Girl86
2
我刚刚注意到您取消了我的下面的回答。如果您有充分的理由,那么没有什么问题。不过,为了进一步学习,如果您评论一下原因,那将非常有趣。这样我就可以学到我的回答哪里出了问题,并可能改进它,以更好地回答您的问题! - DrV
@DrV,就答案本身而言没有什么问题,但我无法使用您提供的代码重现您的结果。我正在尝试确定原因。我还无法将您的代码适应于我的目的,因此我想也许一旦我确实找到了答案来回答我的问题,我会重新接受它作为答案。尽管如此,我计划重新接受它,因为这是一个非常好的答案。 - Palmetto_Girl86
1个回答
14
这是一个有趣的问题,如果我理解正确的话。为了确定你的意思,你希望在所有像素值为3的连续区域周围画一条有颜色的线。
我认为没有现成的函数可以做到这一点,但让我们不要因此而放弃。我们需要创建自己的函数。
我们可以先创建一个需要被勾勒轮廓的区域的布尔地图:
import numpy as np
import matplotlib.pyplot as plt

# our image with the numbers 1-3 is in array maskimg
# create a boolean image map which has trues only where maskimg[x,y] == 3
mapimg = (maskimg == 3)

# a vertical line segment is needed, when the pixels next to each other horizontally
#   belong to diffferent groups (one is part of the mask, the other isn't)
# after this ver_seg has two arrays, one for row coordinates, the other for column coordinates
ver_seg = np.where(mapimg[:,1:] != mapimg[:,:-1])

# the same is repeated for horizontal segments
hor_seg = np.where(mapimg[1:,:] != mapimg[:-1,:])

# if we have a horizontal segment at 7,2, it means that it must be drawn between pixels
#   (2,7) and (2,8), i.e. from (2,8)..(3,8)
# in order to draw a discountinuous line, we add Nones in between segments
l = []
for p in zip(*hor_seg):
    l.append((p[1], p[0]+1))
    l.append((p[1]+1, p[0]+1))
    l.append((np.nan,np.nan))

# and the same for vertical segments
for p in zip(*ver_seg):
    l.append((p[1]+1, p[0]))
    l.append((p[1]+1, p[0]+1))
    l.append((np.nan, np.nan))

# now we transform the list into a numpy array of Nx2 shape
segments = np.array(l)

# now we need to know something about the image which is shown
#   at this point let's assume it has extents (x0, y0)..(x1,y1) on the axis
#   drawn with origin='lower'
# with this information we can rescale our points
segments[:,0] = x0 + (x1-x0) * segments[:,0] / mapimg.shape[1]
segments[:,1] = y0 + (y1-y0) * segments[:,1] / mapimg.shape[0]

# and now there isn't anything else to do than plot it
plt.plot(segments[:,0], segments[:,1], color=(1,0,0,.5), linewidth=3)
我们通过生成一些数据并展示它来测试:
image = np.cumsum(np.random.random((20,20))-.5, axis=1)
maskimg = np.zeros(image.shape, dtype='int')
maskimg[image > 0] = 3

x0 = -1.5
x1 =  1.5
y0 = 2.3
y1 = 3.8

plt.figure()
plt.imshow(maskimg, origin='lower', extent=[x0,x1,y0,y1], cmap=plt.cm.gray, interpolation='nearest')
plt.axis('tight')
接着我们在顶部运行该过程,得到:
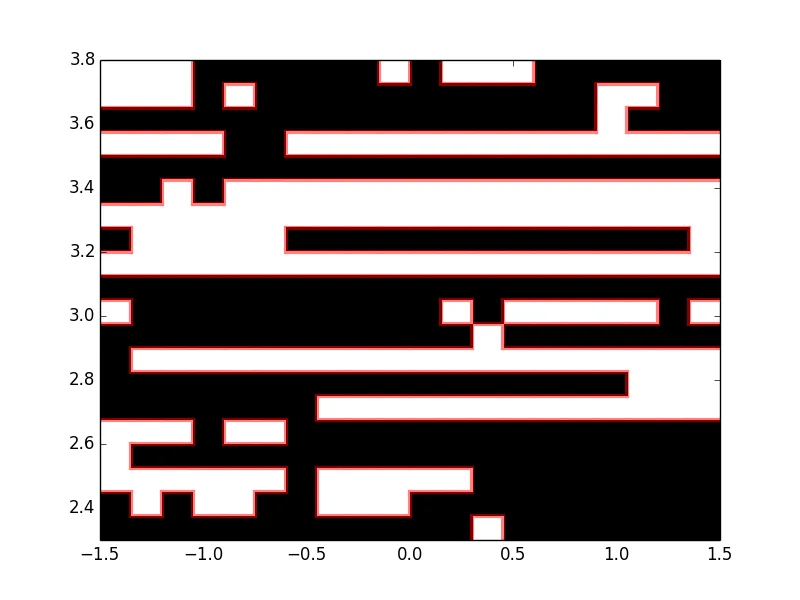
如果需要,代码可以被压缩得更加紧凑,但现在注释占据了很多空间。对于大型图像,通过查找连续路径来优化图像段的创建可能是明智的。这将使要绘制的点的数量减少三分之一。然而,这样做需要稍微不同的代码,不如此清晰。 (如果有评论要求并获得适当数量的赞,我会添加它的 :))
- DrV
1
如果掩码不包含任何段,l 将为空并且失败;-) 感谢这个精彩的片段! - Marti Nito
网页内容由stack overflow 提供, 点击上面的可以查看英文原文,
原文链接
原文链接