我有第一个情节。
为了获得以下内容:
这是否可能?请只使用基本R解决方案(不使用ggplot2 /不使用lattice)。
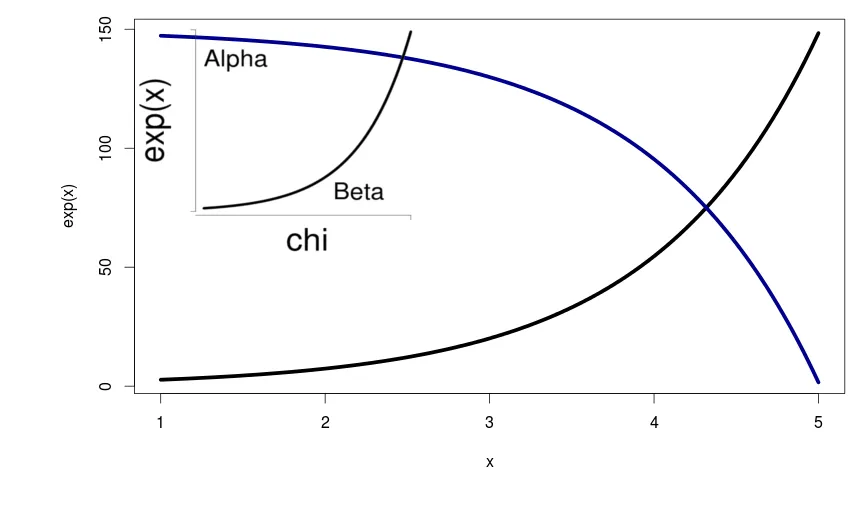
curve(exp(x), from=1, to=5, lwd=5)
curve(150-exp(x), from=1, to=5, lwd=5, col="darkblue",add=T)
我想在其中添加以下的Plot 2。
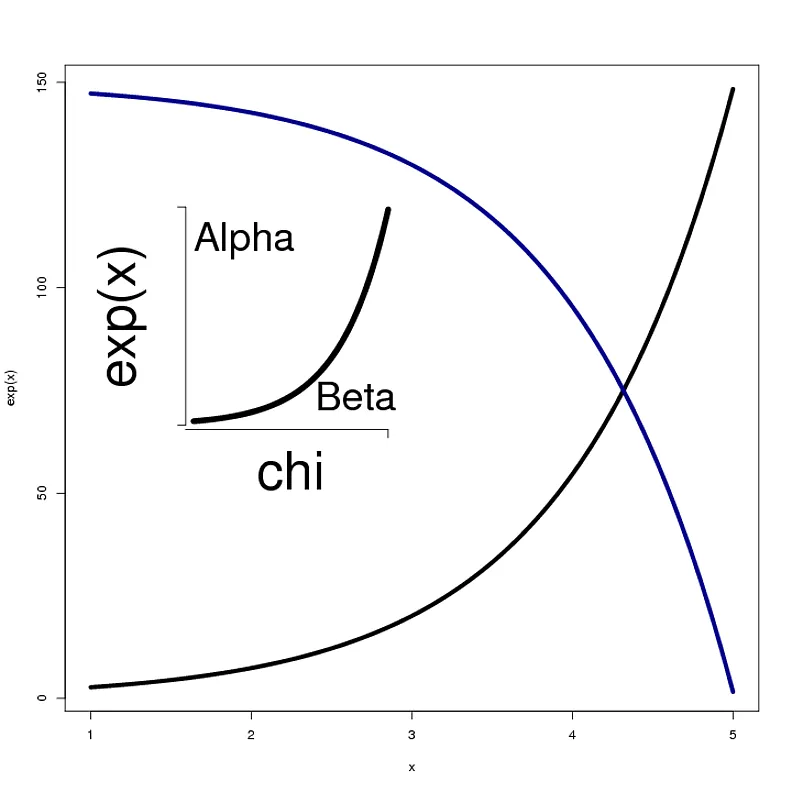
par(mar=c(7,7,1,1))
curve(exp(x), from=1, to=5, lwd=7, xlab="chi", ylab="exp(x)", cex.lab=4,axes=F)
axis(1, labels=NA,at=c(0,5))
axis(2, labels=NA,at=c(0,150))
text(1,120,"Alpha",adj=c(0,0),cex=3)
text(3.5,10,"Beta",adj=c(0,0),cex=3)
为了获得以下内容:
这是否可能?请只使用基本R解决方案(不使用ggplot2 /不使用lattice)。
TeachingDemos中的subplot,但不幸的是没有成功。轴标签的大小和边距出现了问题。不知道为什么,可能是我的问题。 - ECII