我遇到了一种绘制给定时间序列数据的分层聚类图的情况。有人可以告诉我如何画这样的图吗?
我可以使用R或Javascript来实现,特别是使用d3.js。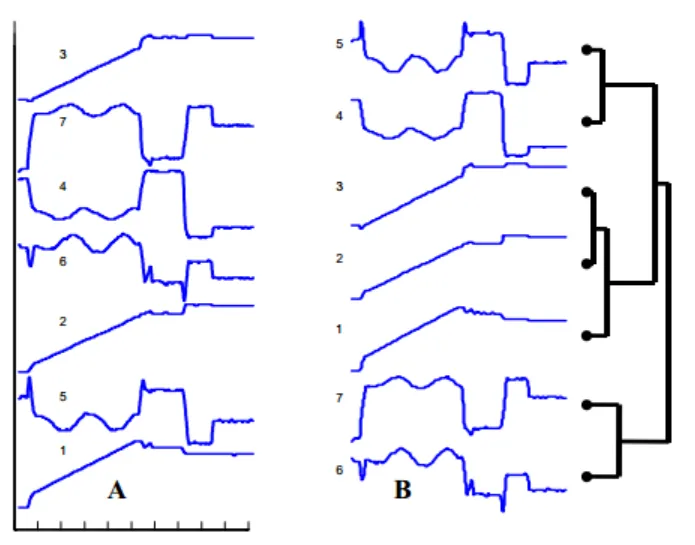
我可以使用R或Javascript来实现,特别是使用d3.js。
fig参数允许您在另一个图表中添加图表。# Sample data
n <- 100
k <- 6
d <- matrix(rnorm(k*n),nc=k)
d[,2] <- d[,1] # To help check the results
colnames(d) <- LETTERS[1:k]
x <- apply(d,2,cumsum)
r <- hclust(dist(t(d)))
# Plot
op <- par(mar=c(0,0,0,0),oma=c(0,2,0,0))
plot(NA,ylim=c(.5,k+.5), xlim=c(0,4),axes=FALSE)
# Dendrogram. See ?hclust for details.
xc <- yc <- rep(NA,k)
o <- 1:k
o[r$order] <- 1:k
for(i in 1:(k-1)) {
a <- r$merge[i,1]
x1 <- if( a<0 ) o[-a] else xc[a]
y1 <- if( a<0 ) 0 else yc[a]
b <- r$merge[i,2]
x2 <- if( b<0 ) o[-b] else xc[b]
y2 <- if( b<0 ) 0 else yc[b]
lines(
3+c(y1,i,i,y2)/k,
c(x1,x1,x2,x2),
lwd=k-i
)
xc[i] <- (x1+x2)/2
yc[i] <- i
}
# Time series
axis(2,1:k,colnames(d)[r$order],las=1)
u <- par()$usr
for(i in 1:k) {
f <- c(0,3,i-.5,i+.5)
f <- c(
(f[1]-u[1])/(u[2]-u[1]),
(f[2]-u[1])/(u[2]-u[1]),
(f[3]-u[3])/(u[4]-u[3]),
(f[4]-u[3])/(u[4]-u[3])
)
par(new=TRUE,fig=f)
plot(x[,r$order[i]],axes=FALSE,xlab="",ylab="",main="",type="l",col="navy",lwd=2)
box()
}
par(op)
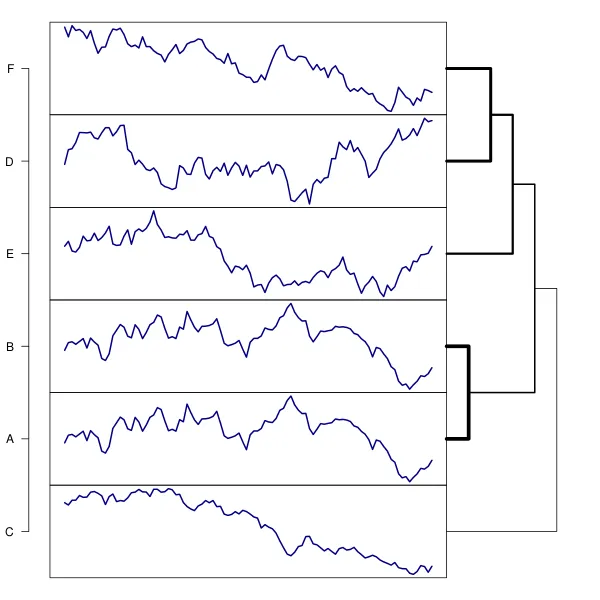
写完之后,我意识到使用layout可能更容易...
hclust对象中树的编码方式,这在手册(?hclust的"Value"章节)中也很神秘,即使对我来说也是如此。最近的dendextend包可能会简化此问题。为了安排图表在图中的位置,我使用par()$usr(在?par中有说明),它返回当前绘图的尺寸和par(new=TRUE,fig=)以将新的图添加到当前图中。 - Vincent Zoonekynd